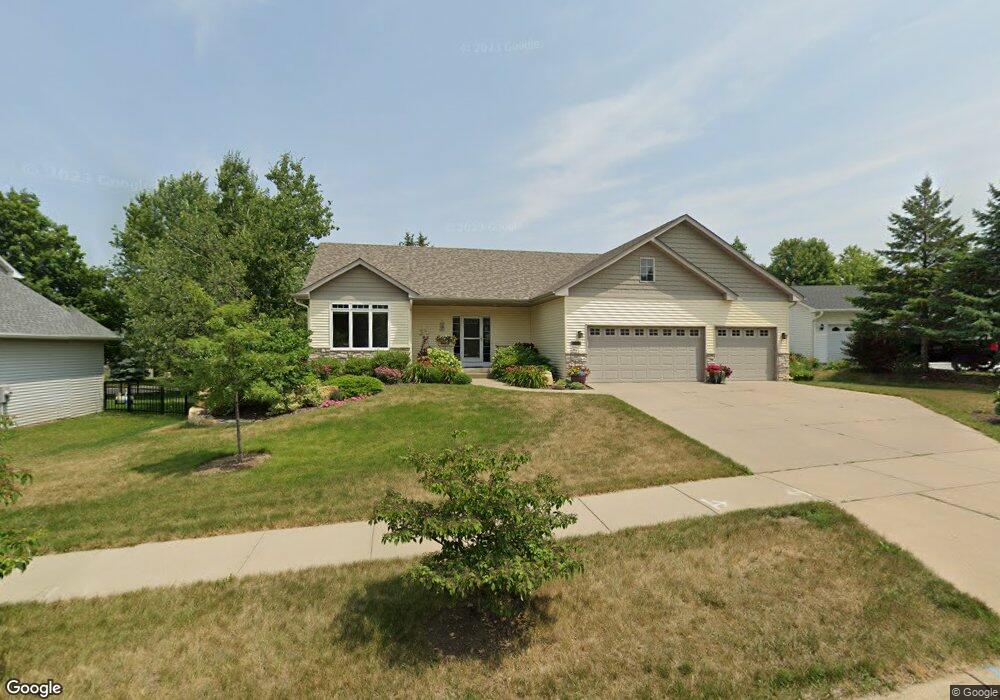
2011 Grant Dr Northfield, MN 55057
Estimated Value: $522,970 - $557,000
About This Home
This home is located at 2011 Grant Dr, Northfield, MN 55057 and is currently estimated at $544,743, approximately $339 per square foot. 2011 Grant Dr is a home located in Rice County with nearby schools including Bridgewater Elementary School, Northfield Middle School, and Northfield Senior High School.
Ownership History
We collect this data history from publicly available records. To have your information removed, we recommend requesting removal directly through your county’s website.
Purchase Details
Home Financials for this Owner
Home Financials are based on the most recent Mortgage that was taken out on this home.Purchase Details
Home Values in the Area
Average Home Value in this Area
Purchase History
We collect this data history from publicly available records. To have your information removed, we recommend requesting removal directly through your county’s website.
| Date | Buyer | Sale Price | Title Company |
|---|---|---|---|
| $355,000 | None Available | ||
| $329,569 | -- |
Mortgage History
We collect this data history from publicly available records. To have your information removed, we recommend requesting removal directly through your county’s website.
| Date | Status | Borrower | Loan Amount |
|---|---|---|---|
| Open | $213,500 |
Tax History
We collect this data history from publicly available records. To have your information removed, we recommend requesting removal directly through your county’s website.
| Year | Tax Paid | Tax Assessment Tax Assessment Total Assessment is a certain percentage of the fair market value that is determined by local assessors to be the total taxable value of land and additions on the property. | Land | Improvement |
|---|---|---|---|---|
| 2026 | $9,110 | $512,100 | $94,500 | $417,600 |
| 2025 | $9,110 | $510,400 | $85,900 | $424,500 |
| 2024 | $8,758 | $480,100 | $79,500 | $400,600 |
| 2023 | $7,074 | $480,100 | $79,500 | $400,600 |
| 2022 | $6,462 | $437,900 | $77,300 | $360,600 |
| 2021 | $6,292 | $388,900 | $68,700 | $320,200 |
| 2020 | $6,078 | $374,000 | $69,400 | $304,600 |
| 2019 | $5,672 | $354,800 | $67,300 | $287,500 |
| 2018 | $5,504 | $328,600 | $62,900 | $265,700 |
| 2017 | $4,736 | $313,700 | $60,100 | $253,600 |
| 2016 | $4,572 | $294,600 | $60,100 | $234,500 |
| 2015 | $4,390 | $272,200 | $60,100 | $212,100 |
| 2014 | -- | $263,900 | $60,100 | $203,800 |
Map
- 2206 Grant Ct
- 701 Carter Dr
- 1600 Roosevelt Dr
- 2215 Greenfield Dr E
- 10545 First Timberlane Dr
- 2204 Valley Dr
- 1655 Pheasantwood Trail
- 1506 Judicial Rd
- 1900 Jefferson Rd
- 1505 Senate Ln
- XXXX Division St S
- 1313 Constitutional Dr
- 2012 Sunnyview Ln
- Outlot Honeylocust Dr
- 2026 Sibley View Ct
- 501 Professional Dr
- 1705 Allison Dr
- 2825 Brockman Ct
- 2804 Oak Lawn Dr
- 563 Summit Ave
Ask me questions while you tour the home.