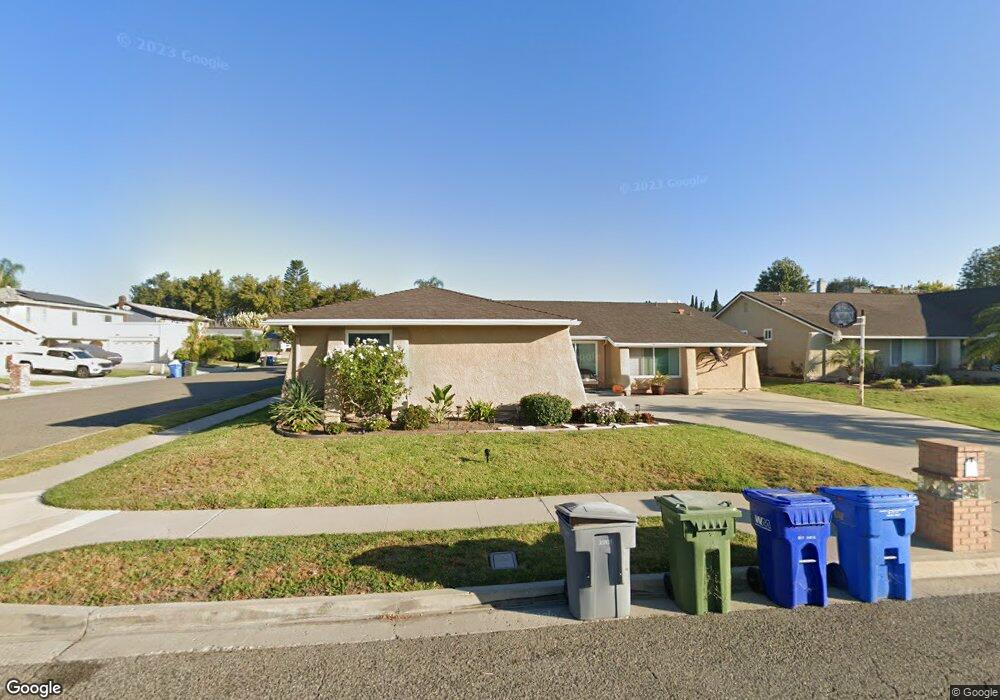
2011 Kimball Ct Simi Valley, CA 93065
Central Simi Valley NeighborhoodEstimated Value: $782,204 - $853,000
4
Beds
2
Baths
1,787
Sq Ft
$463/Sq Ft
Est. Value
About This Home
This home is located at 2011 Kimball Ct, Simi Valley, CA 93065 and is currently estimated at $826,551, approximately $462 per square foot. 2011 Kimball Ct is a home located in Ventura County with nearby schools including Park View Elementary School, Hillside Middle School, and Royal High School.
Ownership History
Date
Name
Owned For
Owner Type
Purchase Details
Closed on
Apr 19, 2011
Sold by
Center Pointe Properties Llc
Bought by
Morales Mark and Morales Angie
Current Estimated Value
Home Financials for this Owner
Home Financials are based on the most recent Mortgage that was taken out on this home.
Original Mortgage
$389,860
Outstanding Balance
$268,339
Interest Rate
4.75%
Mortgage Type
FHA
Estimated Equity
$558,212
Purchase Details
Closed on
Dec 23, 2010
Sold by
Douglas Rogelio R and Douglas Anelaisa S
Bought by
Center Pointe Properties Llc
Create a Home Valuation Report for This Property
The Home Valuation Report is an in-depth analysis detailing your home's value as well as a comparison with similar homes in the area
Home Values in the Area
Average Home Value in this Area
Purchase History
| Date | Buyer | Sale Price | Title Company |
|---|---|---|---|
| Morales Mark | $400,000 | Consumers Title Company | |
| Center Pointe Properties Llc | $305,000 | None Available |
Source: Public Records
Mortgage History
| Date | Status | Borrower | Loan Amount |
|---|---|---|---|
| Open | Morales Mark | $389,860 |
Source: Public Records
Tax History
| Year | Tax Paid | Tax Assessment Tax Assessment Total Assessment is a certain percentage of the fair market value that is determined by local assessors to be the total taxable value of land and additions on the property. | Land | Improvement |
|---|---|---|---|---|
| 2025 | $7,070 | $588,964 | $256,226 | $332,738 |
| 2024 | $7,070 | $577,416 | $251,202 | $326,214 |
| 2023 | $6,648 | $566,095 | $246,277 | $319,818 |
| 2022 | $5,844 | $482,896 | $241,448 | $241,448 |
| 2021 | $5,802 | $473,428 | $236,714 | $236,714 |
| 2020 | $5,682 | $468,576 | $234,288 | $234,288 |
| 2019 | $5,423 | $459,390 | $229,695 | $229,695 |
| 2018 | $5,377 | $450,384 | $225,192 | $225,192 |
| 2017 | $5,258 | $441,554 | $220,777 | $220,777 |
| 2016 | $5,022 | $432,898 | $216,449 | $216,449 |
| 2015 | $4,916 | $426,398 | $213,199 | $213,199 |
| 2014 | $4,847 | $418,048 | $209,024 | $209,024 |
Source: Public Records
Map
Nearby Homes
- 2239 McDonald St
- 1805 Hillary Ct
- 2311 Marvel Ave
- 2357 Lawnview Ct
- 2133 Cochran St
- 2461 Pinewood Place
- 1904 Heywood St Unit L
- 2371 Larch St
- 2002 Malcolm St
- 1932 Heywood St Unit B
- 1755 Heywood St Unit 201
- 2410 N Justin Ave
- 2399 Lee St
- 2405 Lee St
- 2545 Belvedere Ct
- 2165 Malcolm St
- 1954 Claudia Ave
- 1843 Garvin Ave
- 2183 E Chesterton St
- 2325 Wisteria St
- 2027 Kimball Ct
- 2012 Sheridan Ct
- 2028 Sheridan Ct
- 2099 Parker Ct
- 2093 Parker Ct
- 2010 Kimball Ct
- 2045 Kimball Ct
- 2026 Kimball Ct
- 2117 Parker Ct
- 2046 Sheridan Ct
- 2085 Parker Ct
- 2044 Kimball Ct
- 2151 Parker Ct
- 2081 Parker Ct
- 2186 Parker Ct
- 2092 Marter Ave
- 2098 Marter Ave
- 2061 Kimball Ct
- 2009 Sherman St
- 2086 Marter Ave
Your Personal Tour Guide
Ask me questions while you tour the home.