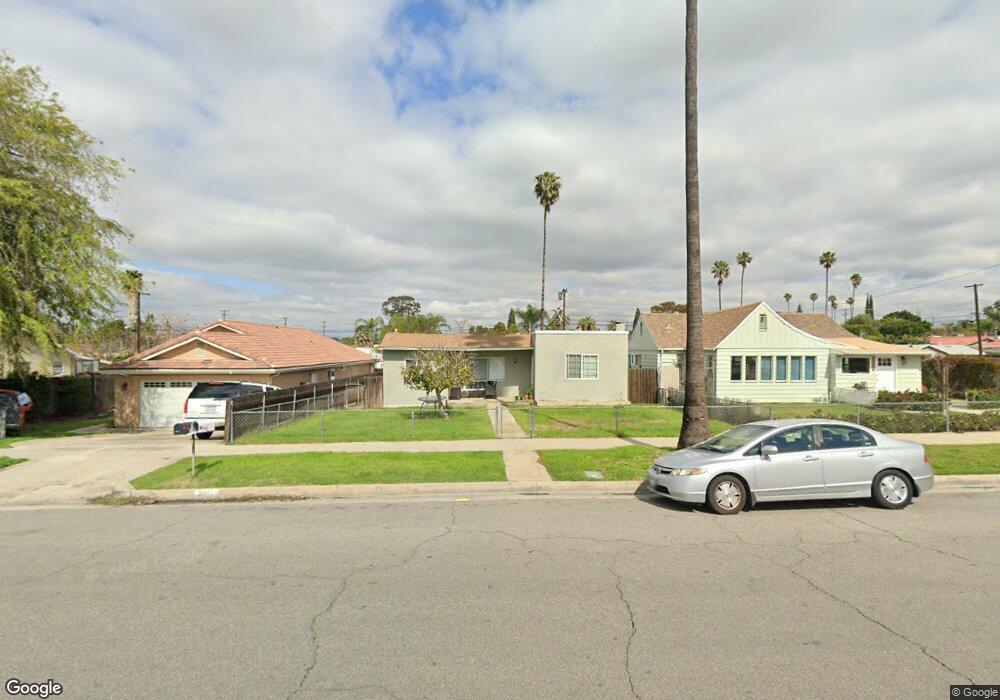
2011 Marlborough Ave Riverside, CA 92507
Estimated Value: $390,000 - $550,000
3
Beds
1
Bath
1,064
Sq Ft
$431/Sq Ft
Est. Value
About This Home
This home is located at 2011 Marlborough Ave, Riverside, CA 92507 and is currently estimated at $458,132, approximately $430 per square foot. 2011 Marlborough Ave is a home located in Riverside County with nearby schools including Highgrove Elementary School, University Heights Middle School, and John W. North High School.
Ownership History
Date
Name
Owned For
Owner Type
Purchase Details
Closed on
Aug 5, 2020
Sold by
Huang Wet and Cui Suwen
Bought by
Huang Wei and Cui Suwen
Current Estimated Value
Purchase Details
Closed on
May 13, 2009
Sold by
Federal Home Loan Mortgage Corporation
Bought by
Huang Wei and Cui Suwen
Purchase Details
Closed on
Jun 11, 2008
Sold by
Sandoval Rodolfo
Bought by
Federal Home Loan Mortgage Corporation
Purchase Details
Closed on
Mar 24, 1999
Sold by
Rodolfo Sandoval
Bought by
Sandoval Rodolfo
Home Financials for this Owner
Home Financials are based on the most recent Mortgage that was taken out on this home.
Original Mortgage
$64,519
Interest Rate
6.79%
Mortgage Type
FHA
Create a Home Valuation Report for This Property
The Home Valuation Report is an in-depth analysis detailing your home's value as well as a comparison with similar homes in the area
Home Values in the Area
Average Home Value in this Area
Purchase History
| Date | Buyer | Sale Price | Title Company |
|---|---|---|---|
| Huang Wei | -- | None Available | |
| Huang Wei | $53,000 | Ticor Title | |
| Federal Home Loan Mortgage Corporation | -- | Accommodation | |
| Sandoval Rodolfo | -- | Orange Coast Title Co |
Source: Public Records
Mortgage History
| Date | Status | Borrower | Loan Amount |
|---|---|---|---|
| Previous Owner | Sandoval Rodolfo | $64,519 |
Source: Public Records
Tax History Compared to Growth
Tax History
| Year | Tax Paid | Tax Assessment Tax Assessment Total Assessment is a certain percentage of the fair market value that is determined by local assessors to be the total taxable value of land and additions on the property. | Land | Improvement |
|---|---|---|---|---|
| 2025 | $798 | $68,227 | $38,622 | $29,605 |
| 2023 | $798 | $65,579 | $37,123 | $28,456 |
| 2022 | $781 | $64,295 | $36,396 | $27,899 |
| 2021 | $787 | $63,035 | $35,683 | $27,352 |
| 2020 | $782 | $62,390 | $35,318 | $27,072 |
| 2019 | $768 | $61,168 | $34,626 | $26,542 |
| 2018 | $754 | $59,970 | $33,947 | $26,023 |
| 2017 | $742 | $58,795 | $33,282 | $25,513 |
| 2016 | $699 | $57,643 | $32,630 | $25,013 |
| 2015 | $688 | $56,780 | $32,141 | $24,639 |
| 2014 | $681 | $55,669 | $31,512 | $24,157 |
Source: Public Records
Map
Nearby Homes
- 1964 Marlborough Ave
- 1909 Marlborough Ave
- 2024 Enna Ct
- 1662 Palermo Dr
- 7922 Brass Kettle Cir
- 1749 Catania Dr
- 1537 Mulberry St
- 1959 Thornton St
- 3469 Columbia Ave
- 1011 W La Cadena Dr
- 1011 W La Cadena Dr Unit 31
- 1498 Powell Way
- 1066 N Orange St
- 2200 E La Cadena Dr
- 0 N Orange St
- 3766 Lofton Place
- 3528 Russell St
- 168 Sir Gawaine Dr
- 3784 Dublin Way
- 2321 Gonzaga Ln
- 2005 Marlborough Ave
- 2019 Marlborough Ave
- 2025 Marlborough Ave
- 2014 Blenheim St
- 2004 Blenheim St
- 2033 Marlborough Ave
- 2022 Blenheim St
- 2032 Blenheim St
- 2016 Marlborough Ave
- 2002 Marlborough Ave
- 1981 Marlborough Ave
- 2037 Marlborough Ave
- 1992 Blenheim St
- 2040 Blenheim St
- 1978 Marlborough Ave
- 1980 Blenheim St
- 1969 Marlborough Ave
- 2050 Blenheim St
- 2047 Marlborough Ave
- 2020 Marlborough Ave