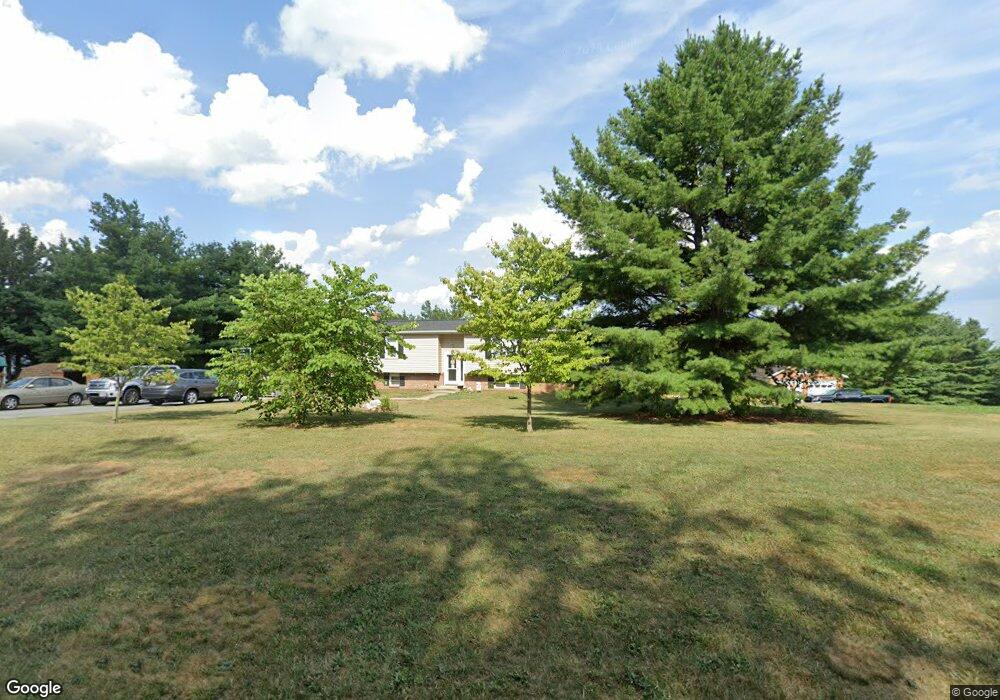
2011 Walsh Dr Westminster, MD 21157
Estimated Value: $393,180 - $455,000
3
Beds
2
Baths
1,338
Sq Ft
$322/Sq Ft
Est. Value
About This Home
This home is located at 2011 Walsh Dr, Westminster, MD 21157 and is currently estimated at $430,795, approximately $321 per square foot. 2011 Walsh Dr is a home located in Carroll County with nearby schools including Manchester Elementary School, North Carroll Middle School, and Manchester Valley High School.
Ownership History
Date
Name
Owned For
Owner Type
Purchase Details
Closed on
Aug 24, 2011
Sold by
Burgoon Charles Edwin
Bought by
Murray Bradley M and Murray Amy R
Current Estimated Value
Home Financials for this Owner
Home Financials are based on the most recent Mortgage that was taken out on this home.
Original Mortgage
$226,775
Outstanding Balance
$156,576
Interest Rate
4.51%
Mortgage Type
FHA
Estimated Equity
$274,219
Purchase Details
Closed on
Jul 22, 2011
Sold by
Burgoon Charles Edwin
Bought by
Murray Bradley M and Murray Amy R
Home Financials for this Owner
Home Financials are based on the most recent Mortgage that was taken out on this home.
Original Mortgage
$226,775
Outstanding Balance
$156,576
Interest Rate
4.51%
Mortgage Type
FHA
Estimated Equity
$274,219
Purchase Details
Closed on
Feb 11, 1987
Sold by
Burgoon Charles Edwin
Bought by
Burgoon Charles Edwin
Purchase Details
Closed on
Aug 17, 1982
Sold by
Mar Ben Ltd Ptrshp Etal
Bought by
Burgoon Charles Edwin
Create a Home Valuation Report for This Property
The Home Valuation Report is an in-depth analysis detailing your home's value as well as a comparison with similar homes in the area
Purchase History
| Date | Buyer | Sale Price | Title Company |
|---|---|---|---|
| Murray Bradley M | $235,000 | -- | |
| Murray Bradley M | $235,000 | Advantage Title Company | |
| Murray Bradley M | $235,000 | -- | |
| Burgoon Charles Edwin | $13,500 | -- | |
| Burgoon Charles Edwin | $16,000 | -- |
Source: Public Records
Mortgage History
| Date | Status | Borrower | Loan Amount |
|---|---|---|---|
| Open | Murray Bradley M | $226,775 | |
| Closed | Murray Bradley M | $226,775 |
Source: Public Records
Tax History
| Year | Tax Paid | Tax Assessment Tax Assessment Total Assessment is a certain percentage of the fair market value that is determined by local assessors to be the total taxable value of land and additions on the property. | Land | Improvement |
|---|---|---|---|---|
| 2025 | $3,307 | $308,200 | $126,300 | $181,900 |
| 2024 | $3,146 | $288,367 | $0 | $0 |
| 2023 | $2,993 | $268,533 | $0 | $0 |
| 2022 | $2,845 | $248,700 | $126,300 | $122,400 |
| 2021 | $5,843 | $247,933 | $0 | $0 |
| 2020 | $2,853 | $247,167 | $0 | $0 |
| 2019 | $2,844 | $246,400 | $126,300 | $120,100 |
| 2018 | $2,759 | $241,033 | $0 | $0 |
| 2017 | $2,699 | $235,667 | $0 | $0 |
| 2016 | -- | $230,300 | $0 | $0 |
| 2015 | -- | $230,300 | $0 | $0 |
| 2014 | -- | $230,300 | $0 | $0 |
Source: Public Records
Map
Nearby Homes
- 1645 Timber Summit Dr
- 2100 Walsh Dr
- Lot 2 Snydersburg Rd
- O/C #1 Snydersburg Rd
- Lot 1 Snydersburg Rd
- Remainder lot Snydersburg
- 1868 Snydersburg Rd
- 0 Hampstead Mexico Rd Unit MDCR2026312
- 1850 Albert Rill Rd
- 1217 Random Ridge Rd
- 1281 Guadelupe Dr
- 0 Bert Fowler Rd Unit MDCR2032556
- 2617 Old Fort Schoolhouse Rd
- 496 Leisters Church Rd
- 2670 Old Fort Schoolhouse Rd
- 2855 Chauncey Hill Dr Unit 33
- 2862 Chauncey Hill Dr Unit 40
- 2748 Vistas Dr Unit 11
- 2841 Chauncey Hill Dr Unit 28
- 1460 Allen Way
Your Personal Tour Guide
Ask me questions while you tour the home.