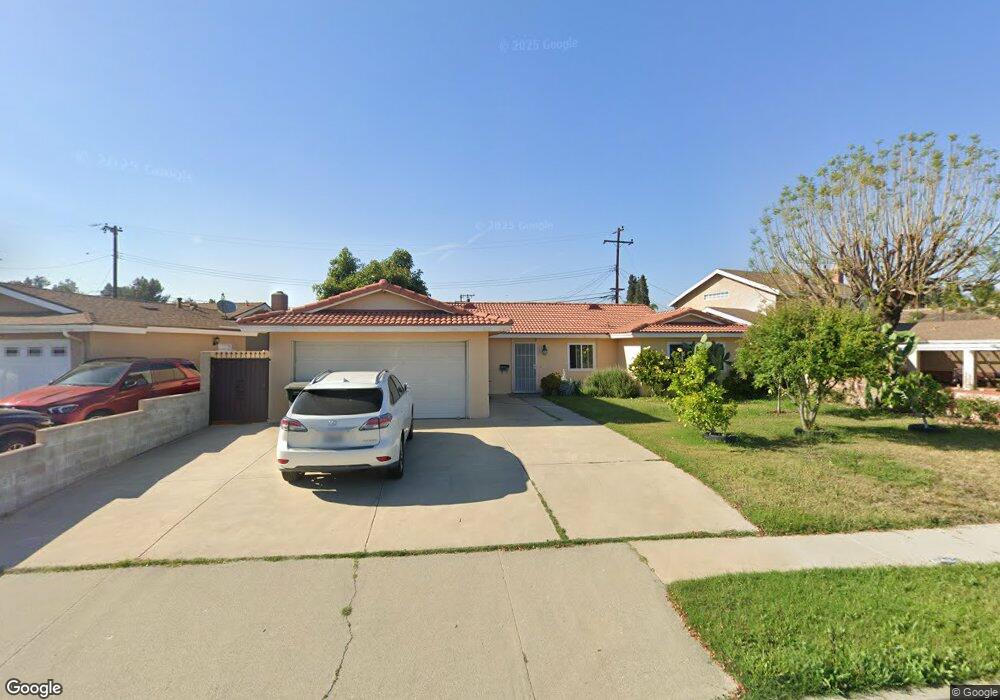
20111 Diehl St Walnut, CA 91789
Estimated Value: $939,000 - $1,079,000
4
Beds
2
Baths
1,789
Sq Ft
$559/Sq Ft
Est. Value
About This Home
This home is located at 20111 Diehl St, Walnut, CA 91789 and is currently estimated at $1,000,333, approximately $559 per square foot. 20111 Diehl St is a home located in Los Angeles County with nearby schools including Vejar Elementary School, Suzanne Middle School, and Walnut High School.
Ownership History
Date
Name
Owned For
Owner Type
Purchase Details
Closed on
Jun 9, 2022
Sold by
Chen Kelu
Bought by
Kelu Chen Living Trust and Chen
Current Estimated Value
Purchase Details
Closed on
Feb 28, 2011
Sold by
Capstone Equity Fund Llc
Bought by
Chen Ke Lu
Home Financials for this Owner
Home Financials are based on the most recent Mortgage that was taken out on this home.
Original Mortgage
$250,000
Interest Rate
4.9%
Mortgage Type
New Conventional
Purchase Details
Closed on
Feb 9, 2010
Sold by
Zhang Kelly
Bought by
Capstone Equity Fund Llc
Purchase Details
Closed on
Oct 16, 2001
Sold by
Robinson James and Robinson Kathleen
Bought by
Zhang Li
Home Financials for this Owner
Home Financials are based on the most recent Mortgage that was taken out on this home.
Original Mortgage
$180,000
Interest Rate
6.67%
Create a Home Valuation Report for This Property
The Home Valuation Report is an in-depth analysis detailing your home's value as well as a comparison with similar homes in the area
Home Values in the Area
Average Home Value in this Area
Purchase History
| Date | Buyer | Sale Price | Title Company |
|---|---|---|---|
| Kelu Chen Living Trust | -- | Fong Daniel | |
| Chen Ke Lu | $435,000 | Fidelity National Title Co | |
| Capstone Equity Fund Llc | -- | None Available | |
| Zhang Li | $226,000 | Chicago Title Insurance |
Source: Public Records
Mortgage History
| Date | Status | Borrower | Loan Amount |
|---|---|---|---|
| Previous Owner | Chen Ke Lu | $250,000 | |
| Previous Owner | Zhang Li | $180,000 |
Source: Public Records
Tax History
| Year | Tax Paid | Tax Assessment Tax Assessment Total Assessment is a certain percentage of the fair market value that is determined by local assessors to be the total taxable value of land and additions on the property. | Land | Improvement |
|---|---|---|---|---|
| 2025 | $7,487 | $611,631 | $324,386 | $287,245 |
| 2024 | $7,487 | $599,639 | $318,026 | $281,613 |
| 2023 | $7,305 | $587,883 | $311,791 | $276,092 |
| 2022 | $7,154 | $576,357 | $305,678 | $270,679 |
| 2021 | $6,415 | $514,861 | $299,685 | $215,176 |
| 2019 | $6,212 | $499,593 | $290,798 | $208,795 |
| 2018 | $5,946 | $489,798 | $285,097 | $204,701 |
| 2016 | $5,514 | $470,780 | $274,027 | $196,753 |
| 2015 | $5,595 | $463,709 | $269,911 | $193,798 |
| 2014 | $5,552 | $454,626 | $264,624 | $190,002 |
Source: Public Records
Map
Nearby Homes
- 180 Ricci Ave
- 330 Amberwood Dr
- 602 Lone Eagle Rd
- 387 Bourdet St
- 455 Avenida Esplendor
- 451 Avenida Esplendor
- 309 Camino de Gloria
- 424 S Lemon Ave
- 3300 E Millridge Dr
- 20824 Fuero Dr
- 3228 La Puente Rd
- 677 Castlehill Dr
- 681 Castlehill Dr
- 685 Castlehill Dr
- 513 Camino de Gloria
- 370 Camino de Teodoro
- 376 Camino de Teodoro
- 792 El Vallencito Dr
- 693 Castlehill Dr
- 3632 S Morganfield Ave
- 20105 Diehl St
- 20121 Diehl St
- 168 N Dommer Ave
- 20131 Diehl St
- 193 Scherer Ave
- 174 N Dommer Ave
- 20112 Diehl St
- 20116 Diehl St
- 195 Scherer Ave
- 20120 Diehl St
- 163 N Dommer Ave
- 153 N Dommer Ave
- 137 N Dommer Ave
- 136 N Dommer Ave
- 167 N Dommer Ave
- 180 N Dommer Ave
- 20128 Diehl St
- 151 N Dommer Ave
- 20203 Diehl St
- 197 Scherer Ave
Your Personal Tour Guide
Ask me questions while you tour the home.