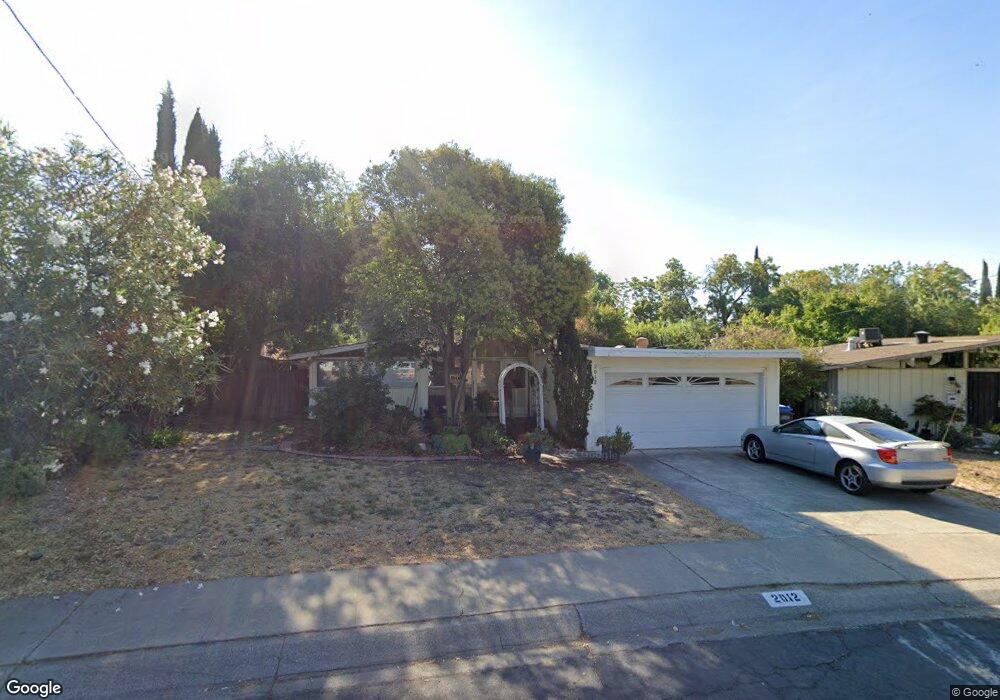
2012 Heaton Cir Concord, CA 94520
Buchanan Field NeighborhoodEstimated Value: $581,000 - $670,438
3
Beds
2
Baths
1,116
Sq Ft
$556/Sq Ft
Est. Value
About This Home
This home is located at 2012 Heaton Cir, Concord, CA 94520 and is currently estimated at $620,860, approximately $556 per square foot. 2012 Heaton Cir is a home located in Contra Costa County with nearby schools including Holbrook Language Academy, Valley View Middle School, and Mt. Diablo High School.
Ownership History
Date
Name
Owned For
Owner Type
Purchase Details
Closed on
Jun 11, 2018
Sold by
Brokman Sandra D
Bought by
Brokman Daniel V and Brokman Sandra D
Current Estimated Value
Purchase Details
Closed on
Feb 21, 2006
Sold by
Brokman Daniel V
Bought by
Brokman Sandra D
Home Financials for this Owner
Home Financials are based on the most recent Mortgage that was taken out on this home.
Original Mortgage
$377,500
Outstanding Balance
$144,079
Interest Rate
1%
Mortgage Type
Negative Amortization
Estimated Equity
$476,781
Purchase Details
Closed on
May 16, 1994
Sold by
Feld Bruce S
Bought by
Santiago Clifford and Santiago Irene
Home Financials for this Owner
Home Financials are based on the most recent Mortgage that was taken out on this home.
Original Mortgage
$126,000
Interest Rate
8.52%
Mortgage Type
Purchase Money Mortgage
Create a Home Valuation Report for This Property
The Home Valuation Report is an in-depth analysis detailing your home's value as well as a comparison with similar homes in the area
Home Values in the Area
Average Home Value in this Area
Purchase History
| Date | Buyer | Sale Price | Title Company |
|---|---|---|---|
| Brokman Daniel V | -- | None Available | |
| Brokman Sandra D | -- | First American Title Co | |
| Brokman Sandra D | $475,000 | First American Title Co | |
| Santiago Clifford | $134,000 | First Amer Title Guaranty Co |
Source: Public Records
Mortgage History
| Date | Status | Borrower | Loan Amount |
|---|---|---|---|
| Open | Brokman Sandra D | $377,500 | |
| Previous Owner | Santiago Clifford | $126,000 |
Source: Public Records
Tax History
| Year | Tax Paid | Tax Assessment Tax Assessment Total Assessment is a certain percentage of the fair market value that is determined by local assessors to be the total taxable value of land and additions on the property. | Land | Improvement |
|---|---|---|---|---|
| 2025 | $8,178 | $649,109 | $519,293 | $129,816 |
| 2024 | $7,821 | $636,382 | $509,111 | $127,271 |
| 2023 | $7,821 | $623,905 | $499,129 | $124,776 |
| 2022 | $7,719 | $611,673 | $489,343 | $122,330 |
| 2021 | $6,624 | $518,500 | $414,804 | $103,696 |
| 2019 | $6,144 | $472,000 | $377,603 | $94,397 |
| 2018 | $5,344 | $412,000 | $329,602 | $82,398 |
| 2017 | $4,761 | $367,500 | $294,002 | $73,498 |
| 2016 | $4,430 | $343,000 | $274,402 | $68,598 |
| 2015 | $3,828 | $289,500 | $231,601 | $57,899 |
| 2014 | $3,315 | $245,500 | $196,401 | $49,099 |
Source: Public Records
Map
Nearby Homes
- 2819 Kay Ave
- 1925 Solano Way
- 2831 Richard Ave
- 2719 Edward Ave
- 2102 Overhill Rd
- 2868 Avon Ave
- 2766 Argyll Ave
- 1838 Overhill Rd
- 2780 Argyll Ave
- 2917 Knoll Dr
- 2829 Hilltop Rd
- 2219 Acacia Dr
- 2067 Olivera Rd Unit B
- 2069 Olivera Rd Unit E
- 2719 Grant St
- 2097 Dalis Dr Unit 79
- 2197 Dalis Dr Unit 124
- 2339 Dalis Dr Unit 193
- 2653 Garden Ave
- 2227 Dalis Dr Unit 159
- 2016 Solano Way
- 2020 Solano Way
- 2008 Heaton Cir
- 2009 Heaton Cir
- 2024 Solano Way
- 2004 Heaton Cir
- 2009 Heaton CI
- 1974 Solano Way
- 2919 Richard Ave
- 2001 Heaton Cir
- 2925 Richard Ave
- 2913 Richard Ave
- 2000 Heaton Cir
- 2028 Solano Way
- 2015 Solano Way
- 2937 Richard Ave
- 1968 Solano Way
- 2005 Solano Way
- 2021 Solano Way
- 2907 Richard Ave
Your Personal Tour Guide
Ask me questions while you tour the home.