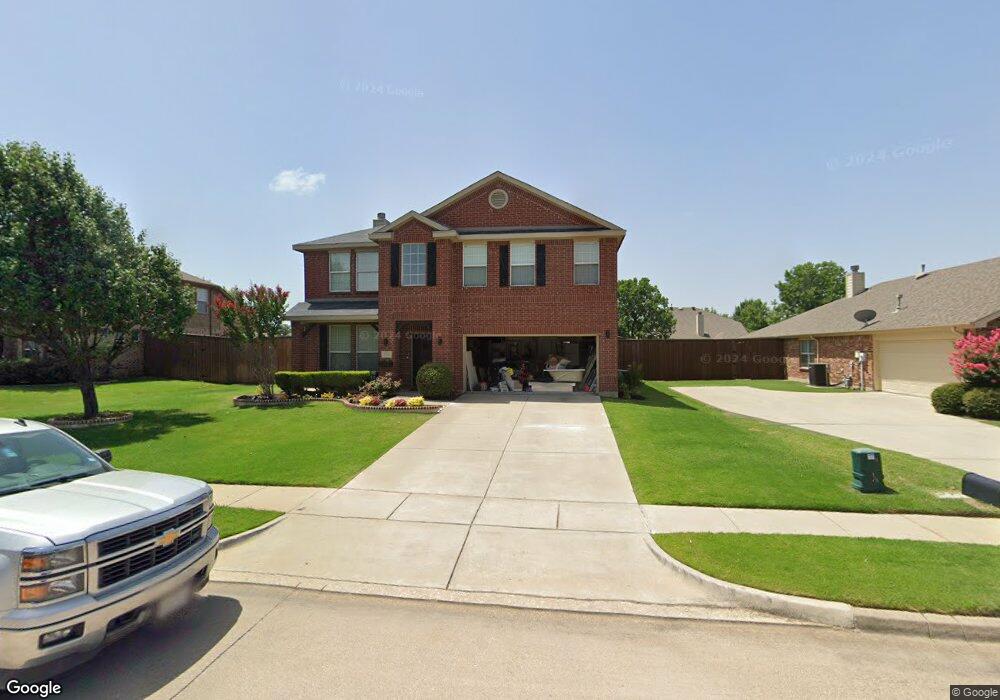
2012 Prescott Downs Dr Denton, TX 76210
South Denton NeighborhoodEstimated Value: $466,000 - $501,000
4
Beds
3
Baths
3,017
Sq Ft
$160/Sq Ft
Est. Value
About This Home
This home is located at 2012 Prescott Downs Dr, Denton, TX 76210 and is currently estimated at $482,757, approximately $160 per square foot. 2012 Prescott Downs Dr is a home located in Denton County with nearby schools including Ryan Elementary School, Crownover Middle School, and Guyer High School.
Ownership History
Date
Name
Owned For
Owner Type
Purchase Details
Closed on
Sep 20, 2013
Sold by
Teav Helena
Bought by
Castro Christopher and Castro Leiza
Current Estimated Value
Home Financials for this Owner
Home Financials are based on the most recent Mortgage that was taken out on this home.
Original Mortgage
$226,227
Outstanding Balance
$169,218
Interest Rate
4.46%
Mortgage Type
VA
Estimated Equity
$313,539
Purchase Details
Closed on
Mar 23, 2007
Sold by
Ashton Dallas Residential Llc
Bought by
Teav Helena
Home Financials for this Owner
Home Financials are based on the most recent Mortgage that was taken out on this home.
Original Mortgage
$162,500
Interest Rate
6.1%
Mortgage Type
Purchase Money Mortgage
Create a Home Valuation Report for This Property
The Home Valuation Report is an in-depth analysis detailing your home's value as well as a comparison with similar homes in the area
Home Values in the Area
Average Home Value in this Area
Purchase History
| Date | Buyer | Sale Price | Title Company |
|---|---|---|---|
| Castro Christopher | -- | Stewart | |
| Teav Helena | -- | Stnt |
Source: Public Records
Mortgage History
| Date | Status | Borrower | Loan Amount |
|---|---|---|---|
| Open | Castro Christopher | $226,227 | |
| Previous Owner | Teav Helena | $162,500 |
Source: Public Records
Tax History
| Year | Tax Paid | Tax Assessment Tax Assessment Total Assessment is a certain percentage of the fair market value that is determined by local assessors to be the total taxable value of land and additions on the property. | Land | Improvement |
|---|---|---|---|---|
| 2025 | $7,820 | $486,231 | $107,781 | $378,450 |
| 2024 | $9,247 | $479,076 | $107,781 | $371,295 |
| 2023 | $6,940 | $438,163 | $107,781 | $417,699 |
| 2022 | $8,456 | $398,330 | $88,103 | $333,359 |
| 2021 | $7,783 | $353,293 | $54,330 | $298,963 |
| 2020 | $6,939 | $303,587 | $54,330 | $249,257 |
| 2019 | $7,112 | $298,062 | $54,330 | $243,732 |
| 2018 | $6,942 | $287,373 | $54,330 | $233,043 |
| 2017 | $6,869 | $277,883 | $54,330 | $223,553 |
| 2016 | $6,296 | $262,195 | $54,330 | $207,865 |
| 2015 | $5,392 | $230,238 | $42,583 | $187,655 |
| 2013 | -- | $193,000 | $42,583 | $150,417 |
Source: Public Records
Map
Nearby Homes
- 1917 Prescott Downs Dr
- 1917 Belmont Park Dr
- 2112 Del Mar Ct
- 7016 Frost Ln
- 7100 Frost Ln
- 4125 Colina Ave
- 1617 Glendora Ct
- 1517 Miranda Ln
- 1913 Pavilion Ln
- 4520 Hammerstein Blvd
- 1500 Vista Verde St
- 2901 Saddle Dr
- 1612 Marble Cove Ln
- 3948 Overlake Dr
- 3933 Parkhaven Dr
- 5021 Split Rock Dr
- 2421 Windhaven Dr
- 8109 Serenity Way
- 5029 Coral Cove
- 8133 Montecito Dr
- 2008 Prescott Downs Dr
- 2016 Prescott Downs Dr
- 2013 Fairmount Park Dr
- 2017 Fairmount Park Dr
- 2020 Prescott Downs Dr
- 2004 Prescott Downs Dr
- 2013 Prescott Downs Dr
- 2017 Prescott Downs Dr
- 2021 Fairmount Park Dr
- 2009 Prescott Downs Dr
- 2009 Fairmount Park Dr
- 2021 Prescott Downs Dr
- 2005 Fairmount Park Dr
- 2100 Prescott Downs Dr
- 2000 Prescott Downs Dr
- 2005 Prescott Downs Dr
- 2101 Prescott Downs Dr
- 2001 Fairmount Park Dr
- 2104 Prescott Downs Dr
- 2012 Fairmount Park Dr
Your Personal Tour Guide
Ask me questions while you tour the home.