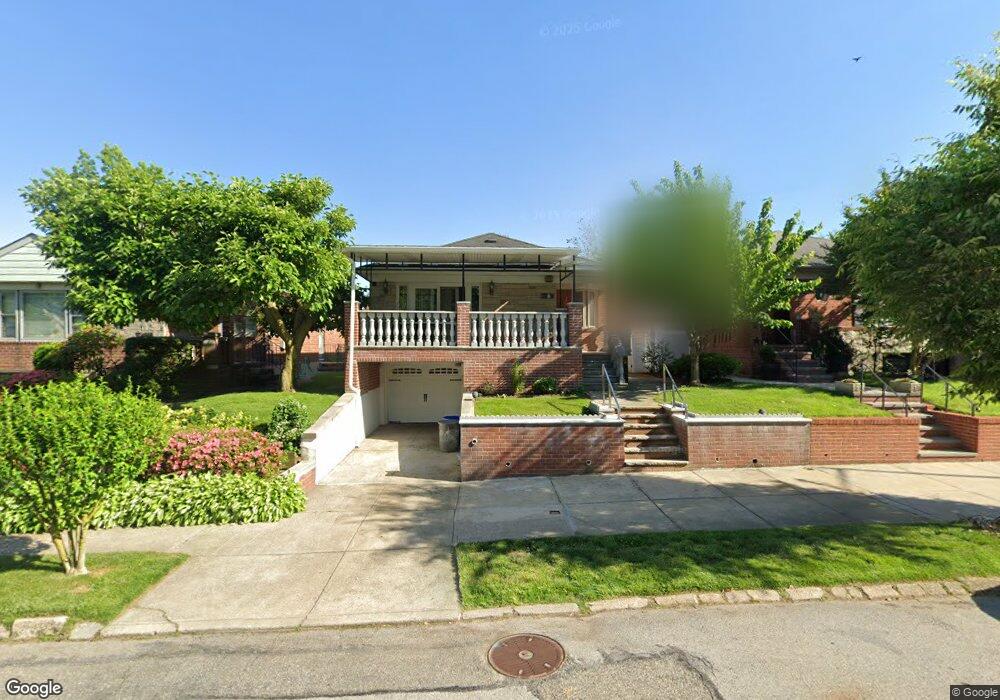
20120 23rd Ave Bayside, NY 11360
Clearview NeighborhoodEstimated Value: $1,034,361 - $1,164,000
About This Home
This home is located at 20120 23rd Ave, Bayside, NY 11360 and is currently estimated at $1,098,340, approximately $929 per square foot. 20120 23rd Ave is a home located in Queens County with nearby schools including P.S. 184 Flushing Manor, I.S. 25 Adrien Block, and Bayside High School.
Ownership History
We collect this data history from publicly available records. To have your information removed, we recommend requesting removal directly through your county’s website.
Purchase Details
Home Financials for this Owner
Home Financials are based on the most recent Mortgage that was taken out on this home.Purchase Details
Home Financials for this Owner
Home Financials are based on the most recent Mortgage that was taken out on this home.Purchase Details
Home Financials for this Owner
Home Financials are based on the most recent Mortgage that was taken out on this home.Home Values in the Area
Average Home Value in this Area
Purchase History
We collect this data history from publicly available records. To have your information removed, we recommend requesting removal directly through your county’s website.
| Date | Buyer | Sale Price | Title Company |
|---|---|---|---|
| $772,425 | -- | ||
| $998,000 | -- | ||
| $998,000 | -- | ||
| $998,000 | -- | ||
| -- | -- | ||
| -- | -- |
Mortgage History
We collect this data history from publicly available records. To have your information removed, we recommend requesting removal directly through your county’s website.
| Date | Status | Borrower | Loan Amount |
|---|---|---|---|
| Open | $380,000 | ||
| Previous Owner | $748,500 | ||
| Previous Owner | $250,000 |
Tax History
We collect this data history from publicly available records. To have your information removed, we recommend requesting removal directly through your county’s website.
| Year | Tax Paid | Tax Assessment Tax Assessment Total Assessment is a certain percentage of the fair market value that is determined by local assessors to be the total taxable value of land and additions on the property. | Land | Improvement |
|---|---|---|---|---|
| 2026 | $11,058 | $57,583 | $12,980 | $44,603 |
| 2025 | $10,442 | $55,056 | $11,674 | $43,382 |
| 2024 | $10,442 | $51,988 | $11,970 | $40,018 |
| 2023 | $10,042 | $49,997 | $11,591 | $38,406 |
| 2022 | $9,666 | $54,600 | $14,160 | $40,440 |
| 2021 | $9,803 | $58,380 | $14,160 | $44,220 |
| 2020 | $9,403 | $56,340 | $14,160 | $42,180 |
| 2019 | $8,770 | $58,560 | $14,160 | $44,400 |
| 2018 | $8,196 | $41,664 | $12,353 | $29,311 |
| 2017 | $6,167 | $41,548 | $12,619 | $28,929 |
| 2016 | $7,684 | $41,548 | $12,619 | $28,929 |
| 2015 | $4,508 | $38,233 | $13,836 | $24,397 |
| 2014 | $4,508 | $36,103 | $15,686 | $20,417 |
Map
- 21-38 202nd St Unit 1-208
- 19947 22nd Ave Unit Upper
- 21-20 202nd St Unit 1-189
- 199-23 22nd Ave Unit 1-260
- 21-29 Utopia Pkwy Unit UPSTAIRS
- 201-04 24th Rd
- 23-55 205th St
- 21-47 Utopia Pkwy Unit 2
- 21-41 Utopia Pkwy Unit LOWER
- 19916 21st Ave Unit 1336
- 199-15 21 Ave Unit 1-356
- 199-27 26th Ave
- 20-17 Utopia Pkwy Unit Upper
- 2374 207th St
- 203-55 27th Ave
- 201-02 19th Ave Unit 2-142
- 169-01 22nd Ave
- 16904 22nd Ave
- 199-18 19th Ave Unit 18
- 27-15 203rd St
Ask me questions while you tour the home.