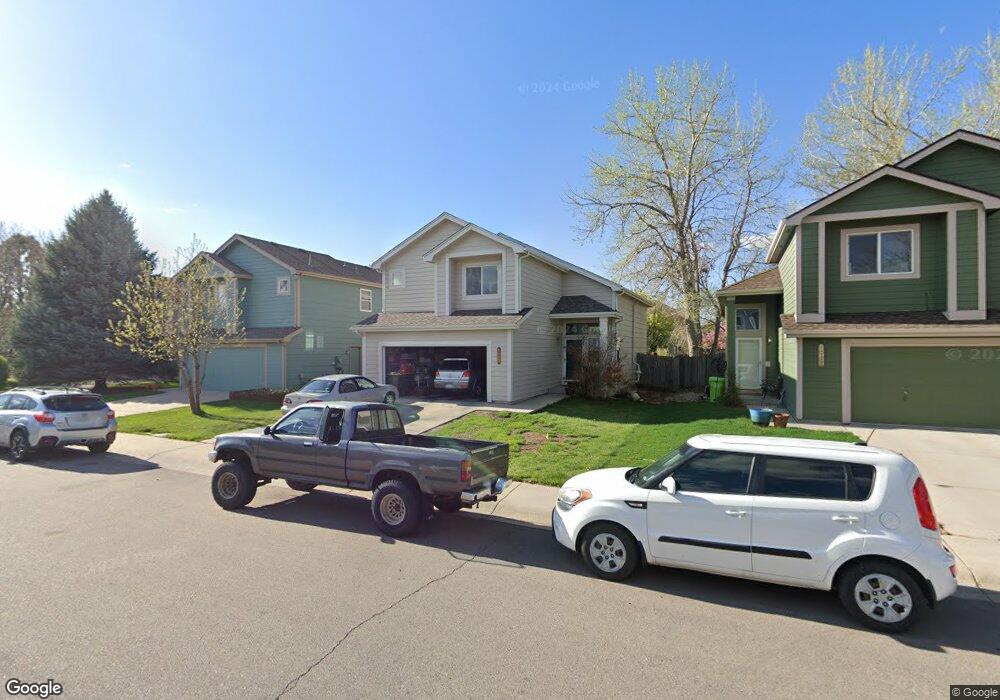
2013 Amber Ct Fort Collins, CO 80528
Estimated Value: $506,000 - $533,000
3
Beds
3
Baths
1,766
Sq Ft
$293/Sq Ft
Est. Value
About This Home
This home is located at 2013 Amber Ct, Fort Collins, CO 80528 and is currently estimated at $517,847, approximately $293 per square foot. 2013 Amber Ct is a home located in Larimer County with nearby schools including Kruse Elementary School, Boltz Middle School, and Fort Collins High School.
Ownership History
Date
Name
Owned For
Owner Type
Purchase Details
Closed on
Aug 30, 2004
Sold by
Lambert James Eric and Lambert Deborah G
Bought by
Azevedo James Louis and Azevedo Karen Sue
Current Estimated Value
Purchase Details
Closed on
Jul 27, 1998
Sold by
Seifert Paul Jerome and Seifert Barbara J
Bought by
Lambert James Eric and Lambert Deborah G
Home Financials for this Owner
Home Financials are based on the most recent Mortgage that was taken out on this home.
Original Mortgage
$140,900
Interest Rate
6.94%
Purchase Details
Closed on
Dec 1, 1995
Sold by
U S Home Corp
Bought by
Seifert Paul Jerome
Purchase Details
Closed on
Apr 1, 1995
Sold by
Gateway American Properties Llc
Bought by
U S Home Corp
Purchase Details
Closed on
Oct 1, 1994
Sold by
Richland Development Co Llc
Bought by
Gateway American Properties Llc
Purchase Details
Closed on
May 1, 1994
Sold by
Imago Enterprises Inc
Bought by
Richland Development Co Llc
Create a Home Valuation Report for This Property
The Home Valuation Report is an in-depth analysis detailing your home's value as well as a comparison with similar homes in the area
Home Values in the Area
Average Home Value in this Area
Purchase History
| Date | Buyer | Sale Price | Title Company |
|---|---|---|---|
| Azevedo James Louis | $215,000 | Chicago Title Co | |
| Lambert James Eric | $151,900 | Stewart Title | |
| Seifert Paul Jerome | $138,400 | -- | |
| U S Home Corp | $305,200 | -- | |
| Gateway American Properties Llc | $341,000 | -- | |
| Richland Development Co Llc | $758,800 | -- |
Source: Public Records
Mortgage History
| Date | Status | Borrower | Loan Amount |
|---|---|---|---|
| Previous Owner | Lambert James Eric | $140,900 |
Source: Public Records
Tax History Compared to Growth
Tax History
| Year | Tax Paid | Tax Assessment Tax Assessment Total Assessment is a certain percentage of the fair market value that is determined by local assessors to be the total taxable value of land and additions on the property. | Land | Improvement |
|---|---|---|---|---|
| 2025 | $3,090 | $35,885 | $3,015 | $32,870 |
| 2024 | $2,940 | $35,885 | $3,015 | $32,870 |
| 2022 | $2,493 | $26,397 | $3,128 | $23,269 |
| 2021 | $2,519 | $27,156 | $3,218 | $23,938 |
| 2020 | $2,610 | $27,893 | $3,218 | $24,675 |
| 2019 | $2,621 | $27,893 | $3,218 | $24,675 |
| 2018 | $1,987 | $21,802 | $3,240 | $18,562 |
| 2017 | $1,980 | $21,802 | $3,240 | $18,562 |
| 2016 | $1,894 | $20,744 | $3,582 | $17,162 |
| 2015 | $1,880 | $20,740 | $3,580 | $17,160 |
| 2014 | $1,630 | $17,870 | $3,580 | $14,290 |
Source: Public Records
Map
Nearby Homes
- 2055 Angelo Dr
- 2120 Timber Creek Dr Unit H4
- 2120 Timber Creek Dr Unit K1
- 5121 Stillwater Creek Dr Unit B
- 2138 Copper Creek Dr Unit B
- 2208 Copper Creek Dr Unit A
- 4913 Smallwood Ct
- 2142 Stetson Creek Dr
- 2107 Stillwater Creek Dr
- 5225 White Willow Dr Unit F200
- 5225 White Willow Dr Unit N210
- 5225 White Willow Dr Unit J110
- 2021 Timberline Ln
- 1715 Globe Ct
- 5502 Weeping Way
- 4751 Pleasant Oak Dr Unit C83
- 4751 Pleasant Oak Dr Unit C65
- 5114 Country Squire Way
- 2602 Timberwood Dr Unit 2
- 2602 Timberwood Dr Unit 52