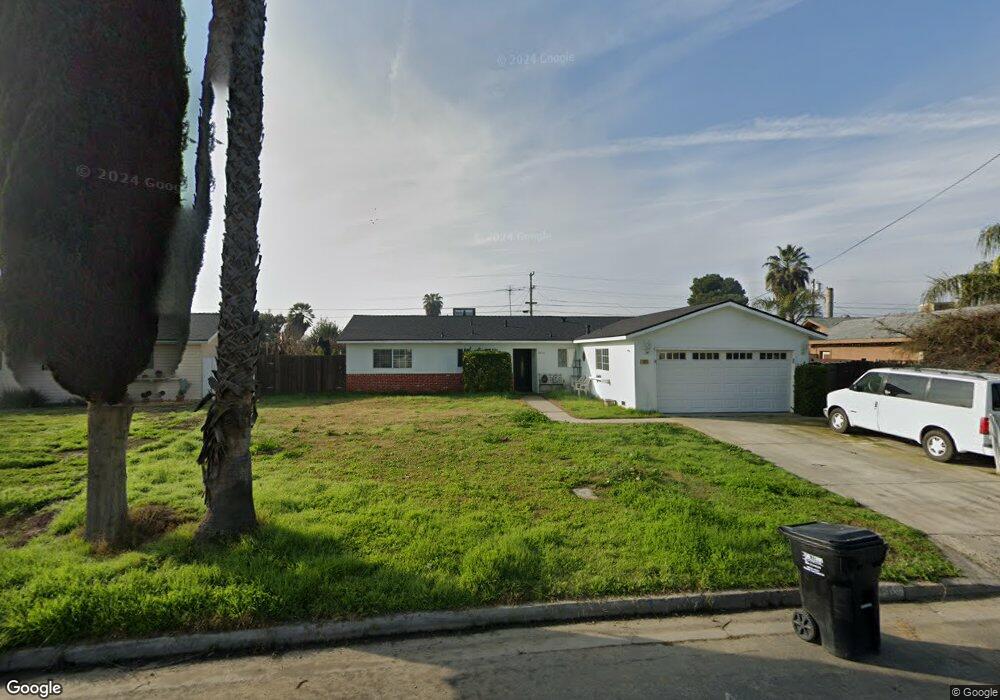
2013 Gable Ave Corcoran, CA 93212
Estimated Value: $271,000 - $602,000
3
Beds
2
Baths
9,999
Sq Ft
$36/Sq Ft
Est. Value
About This Home
This home is located at 2013 Gable Ave, Corcoran, CA 93212 and is currently estimated at $359,411, approximately $35 per square foot. 2013 Gable Ave is a home located in Kings County with nearby schools including John C. Fremont Elementary School, Bret Harte Elementary School, and Mark Twain Elementary School.
Ownership History
Date
Name
Owned For
Owner Type
Purchase Details
Closed on
May 1, 2002
Sold by
Kaweah Financial Group Inc
Bought by
Burks Barney and Burks Eula B
Current Estimated Value
Purchase Details
Closed on
Apr 22, 2002
Sold by
Burks Barney and Burks Eula B
Bought by
Ruvalcaba Jose T and Ruvalcaba Ofelia
Purchase Details
Closed on
Mar 4, 2002
Sold by
Swanger Nick and Swanger Sharon
Bought by
Kaweah Financial Group Inc and Kaweah Mtg
Purchase Details
Closed on
Mar 19, 2001
Sold by
Hud
Bought by
Swanger Nick and Swanger Sharon
Home Financials for this Owner
Home Financials are based on the most recent Mortgage that was taken out on this home.
Original Mortgage
$63,700
Interest Rate
6.97%
Purchase Details
Closed on
Jul 21, 2000
Sold by
Countrywide Home Loans
Bought by
Hud
Purchase Details
Closed on
Jul 20, 2000
Sold by
Lemay Barbara
Bought by
Countrywide Home Loans Inc
Create a Home Valuation Report for This Property
The Home Valuation Report is an in-depth analysis detailing your home's value as well as a comparison with similar homes in the area
Purchase History
| Date | Buyer | Sale Price | Title Company |
|---|---|---|---|
| Burks Barney | -- | First American Title Co | |
| Ruvalcaba Jose T | $85,000 | First American Title Co | |
| Kaweah Financial Group Inc | $69,767 | First American Title Co | |
| Swanger Nick | $50,000 | North American Title Co | |
| Hud | -- | First American Title Co | |
| Countrywide Home Loans Inc | $79,084 | First American Title Co |
Source: Public Records
Mortgage History
| Date | Status | Borrower | Loan Amount |
|---|---|---|---|
| Previous Owner | Swanger Nick | $63,700 |
Source: Public Records
Tax History
| Year | Tax Paid | Tax Assessment Tax Assessment Total Assessment is a certain percentage of the fair market value that is determined by local assessors to be the total taxable value of land and additions on the property. | Land | Improvement |
|---|---|---|---|---|
| 2025 | $1,230 | $125,574 | $35,457 | $90,117 |
| 2023 | $1,230 | $120,699 | $34,081 | $86,618 |
| 2022 | $1,187 | $118,333 | $33,413 | $84,920 |
| 2021 | $1,162 | $116,013 | $32,758 | $83,255 |
| 2020 | $1,146 | $114,823 | $32,422 | $82,401 |
| 2019 | $1,348 | $112,571 | $31,786 | $80,785 |
| 2018 | $1,330 | $110,364 | $31,163 | $79,201 |
| 2017 | $1,303 | $108,200 | $30,552 | $77,648 |
| 2016 | $1,071 | $106,078 | $29,953 | $76,125 |
| 2015 | $1,068 | $104,485 | $29,503 | $74,982 |
| 2014 | $1,048 | $102,438 | $28,925 | $73,513 |
Source: Public Records
Map
Nearby Homes
- 510 Claire Ave
- 508 Claire Ave
- 1766 North Ave
- 514 Josephine Ave
- 2217 Gable Ave
- 2220 North Ave
- 310 Wawona Ave
- 2312 North Ave
- 2023 Garvey Ave
- 2113 Garvey Ave
- 726 Josephine Ave
- 1901 Patterson Ave
- 2310 Patterson Ave
- 0 Patterson Ave
- 446 6 1 2 Ave
- 2323 Patterson Ave
- 628 Norboe Ave
- 2414 Strepy Ave
- 2615 Gable Ave
- 2632 North Ave
- 2009 Gable Ave
- 2017 Gable Ave
- 2012 Philip Ave
- 2016 Philip Ave
- 2005 Gable Ave
- 2008 Philip Ave
- 2021 Gable Ave
- 2008 Gable Ave
- 2004 Philip Ave
- 2014 Gable Ave
- 508 Dairy Ave
- 2026 Philip Ave
- 2025 Gable Ave
- 2004 Gable Ave
- 514 Dairy Ave
- 2104 Philip Ave
- 2020 Gable Ave
- 2101 Charles St
- 2000 Gable Ave
- 2013 Charles St
Your Personal Tour Guide
Ask me questions while you tour the home.