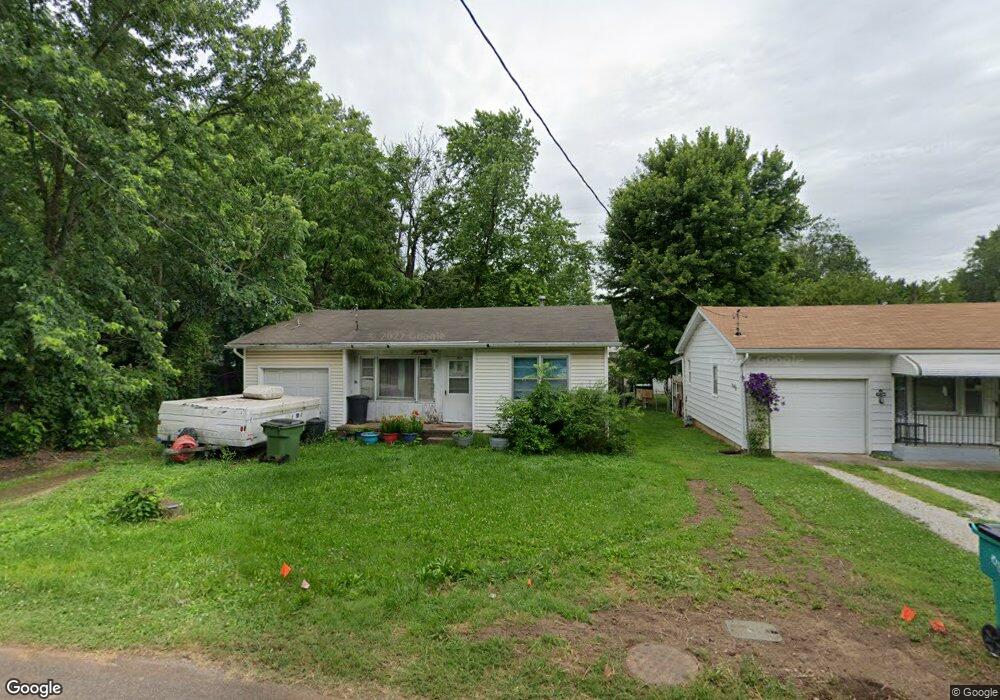
2013 N Hoffman Ave Springfield, MO 65803
Tom Watkins NeighborhoodEstimated Value: $132,000 - $157,000
3
Beds
2
Baths
1,087
Sq Ft
$133/Sq Ft
Est. Value
About This Home
This home is located at 2013 N Hoffman Ave, Springfield, MO 65803 and is currently estimated at $145,003, approximately $133 per square foot. 2013 N Hoffman Ave is a home located in Greene County with nearby schools including Williams Elementary School, Reed Academy, and Hillcrest High School.
Create a Home Valuation Report for This Property
The Home Valuation Report is an in-depth analysis detailing your home's value as well as a comparison with similar homes in the area
Home Values in the Area
Average Home Value in this Area
Tax History
| Year | Tax Paid | Tax Assessment Tax Assessment Total Assessment is a certain percentage of the fair market value that is determined by local assessors to be the total taxable value of land and additions on the property. | Land | Improvement |
|---|---|---|---|---|
| 2025 | $773 | $15,520 | $2,850 | $12,670 |
| 2024 | $742 | $13,830 | $1,900 | $11,930 |
| 2023 | $738 | $13,830 | $1,900 | $11,930 |
| 2022 | $618 | $11,320 | $1,900 | $9,420 |
| 2021 | $618 | $11,320 | $1,900 | $9,420 |
| 2020 | $596 | $10,430 | $1,900 | $8,530 |
| 2019 | $579 | $10,430 | $1,900 | $8,530 |
| 2018 | $597 | $10,770 | $1,900 | $8,870 |
| 2017 | $591 | $10,770 | $1,900 | $8,870 |
| 2016 | $590 | $10,770 | $1,900 | $8,870 |
| 2015 | $585 | $10,770 | $1,900 | $8,870 |
| 2014 | $589 | $10,770 | $1,900 | $8,870 |
Source: Public Records
Map
Nearby Homes
- 2104 N Park Ave
- 2009 N Park Ave
- 1956 W Atlantic St
- 2119 N Marion Ave
- 2130 N Park Ave
- 2105 N Elizabeth Ave
- 2111 N Elizabeth Ave
- 2020 N Columbia Ave
- 2101 N Grace Ave
- 2130 N Elizabeth Ave
- 2074 N Columbia Ave
- 2237 N Park Ave
- 2406 W High St
- 2217 N Grace Ave
- 2117 N Lexington Ave
- Lot 1 N Grace Ave
- Lot 13 N Grace Ave
- Lot 3 N Grace Ave
- Lot 2 N Grace Ave
- 1700 W Atlantic St
- 2019 N Hoffman Ave
- 2135 W Atlantic St
- 2025 N Hoffman Ave
- 2141 W Atlantic St
- 2131 W Atlantic St
- 2014 N Park Ave
- 2033 N Hoffman Ave
- 2010 N Park Ave
- 2018 N Park Ave
- 2123 W Atlantic St
- 2004 N Park Ave
- 2018 N Hoffman Ave
- 0 N Park Ave
- 3200 N Park Ave
- 3052 N Park Ave
- 2000 N Park Ave
- 2028 N Park Ave
- 2117 W Atlantic St
- 2028 N Hoffman Ave
- 2041 N Hoffman Ave
Your Personal Tour Guide
Ask me questions while you tour the home.