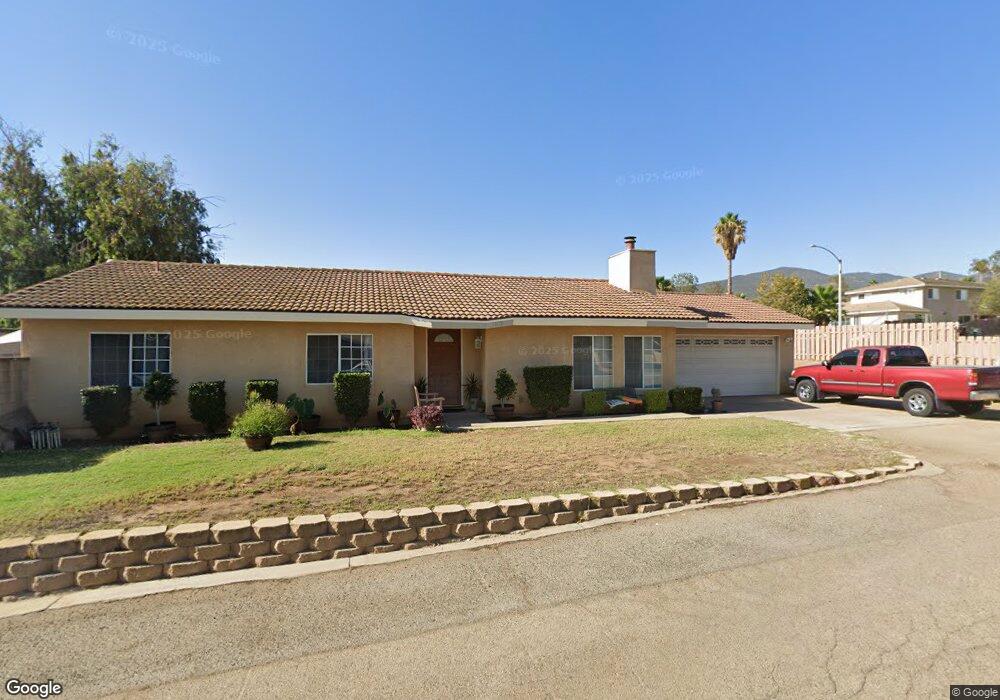
20130 Layton St Corona, CA 92881
Eagle Glen NeighborhoodEstimated Value: $629,343 - $720,000
3
Beds
2
Baths
1,372
Sq Ft
$494/Sq Ft
Est. Value
About This Home
This home is located at 20130 Layton St, Corona, CA 92881 and is currently estimated at $677,836, approximately $494 per square foot. 20130 Layton St is a home located in Riverside County with nearby schools including Orange Elementary School, Citrus Hills Intermediate School, and Santiago High School.
Ownership History
Date
Name
Owned For
Owner Type
Purchase Details
Closed on
Jun 8, 2018
Sold by
Salazar Katherine
Bought by
Salazar Katherine
Current Estimated Value
Home Financials for this Owner
Home Financials are based on the most recent Mortgage that was taken out on this home.
Original Mortgage
$10,000
Outstanding Balance
$8,648
Interest Rate
4.5%
Mortgage Type
Purchase Money Mortgage
Estimated Equity
$669,188
Purchase Details
Closed on
Jul 10, 1997
Sold by
Va
Bought by
Salazar Arthur L and Salazar Katherine
Home Financials for this Owner
Home Financials are based on the most recent Mortgage that was taken out on this home.
Original Mortgage
$117,265
Outstanding Balance
$17,298
Interest Rate
7.83%
Mortgage Type
FHA
Estimated Equity
$660,538
Purchase Details
Closed on
Nov 26, 1996
Sold by
Fleet Mtg Corp
Bought by
Va
Create a Home Valuation Report for This Property
The Home Valuation Report is an in-depth analysis detailing your home's value as well as a comparison with similar homes in the area
Home Values in the Area
Average Home Value in this Area
Purchase History
| Date | Buyer | Sale Price | Title Company |
|---|---|---|---|
| Salazar Katherine | -- | Stewart Title Of California | |
| Salazar Arthur L | $118,000 | First American Title Ins Co | |
| Va | -- | First Southwestern Title Co | |
| Fleet Mtg Corp | $99,746 | First Southwestern Title Co |
Source: Public Records
Mortgage History
| Date | Status | Borrower | Loan Amount |
|---|---|---|---|
| Open | Salazar Katherine | $10,000 | |
| Open | Salazar Arthur L | $117,265 |
Source: Public Records
Tax History
| Year | Tax Paid | Tax Assessment Tax Assessment Total Assessment is a certain percentage of the fair market value that is determined by local assessors to be the total taxable value of land and additions on the property. | Land | Improvement |
|---|---|---|---|---|
| 2025 | $1,997 | $188,371 | $63,848 | $124,523 |
| 2023 | $1,997 | $181,059 | $61,370 | $119,689 |
| 2022 | $1,930 | $177,510 | $60,167 | $117,343 |
| 2021 | $1,890 | $174,031 | $58,988 | $115,043 |
| 2020 | $1,868 | $172,248 | $58,384 | $113,864 |
| 2019 | $1,824 | $168,872 | $57,240 | $111,632 |
| 2018 | $1,781 | $165,562 | $56,118 | $109,444 |
| 2017 | $1,736 | $162,317 | $55,018 | $107,299 |
| 2016 | $1,718 | $159,136 | $53,940 | $105,196 |
| 2015 | $1,680 | $156,748 | $53,131 | $103,617 |
| 2014 | $1,617 | $153,681 | $52,092 | $101,589 |
Source: Public Records
Map
Nearby Homes
- 20065 Case St
- 20070 Winton Rd
- 1881 Duncan Way
- 2887 Villa Catalonia Ct
- 3260 Howe St
- 1767 Riverstone Cir
- 2785 State St
- 7230 Sarsaparilla Dr
- 3704 Howe St
- 1806 Riverstone St
- 7245 Marilyn Dr
- 1855 Stanwich Place
- 1916 Olympia Fields Dr
- 1610 Via Roma Cir
- 2239 Melogold Way
- 3228 Willow Park Dr
- 3934 Lavine Way Unit 108
- 19586 Temescal Canyon Rd
- 3942 Lavine Way
- 4059 Pomelo Dr
- 20140 Layton St
- 20150 Layton St
- 7262 Bobbitt Ave
- 0 Bobitt Unit A12024485
- 20127 Kayne St
- 20160 Layton St
- 20145 Kayne St
- 20170 Layton St
- 20100 Layton St
- 20115 Kayne St
- 20099 Layton St
- 7230 Sackett Ct
- 20195 Kayne St
- 1786 Bobbitt Ave
- 20180 Layton St
- 20090 Layton St
- 20173 Kayne St
- 20095 Kayne St
- 7360 Bobbitt Ave
- 20080 Layton St
Your Personal Tour Guide
Ask me questions while you tour the home.