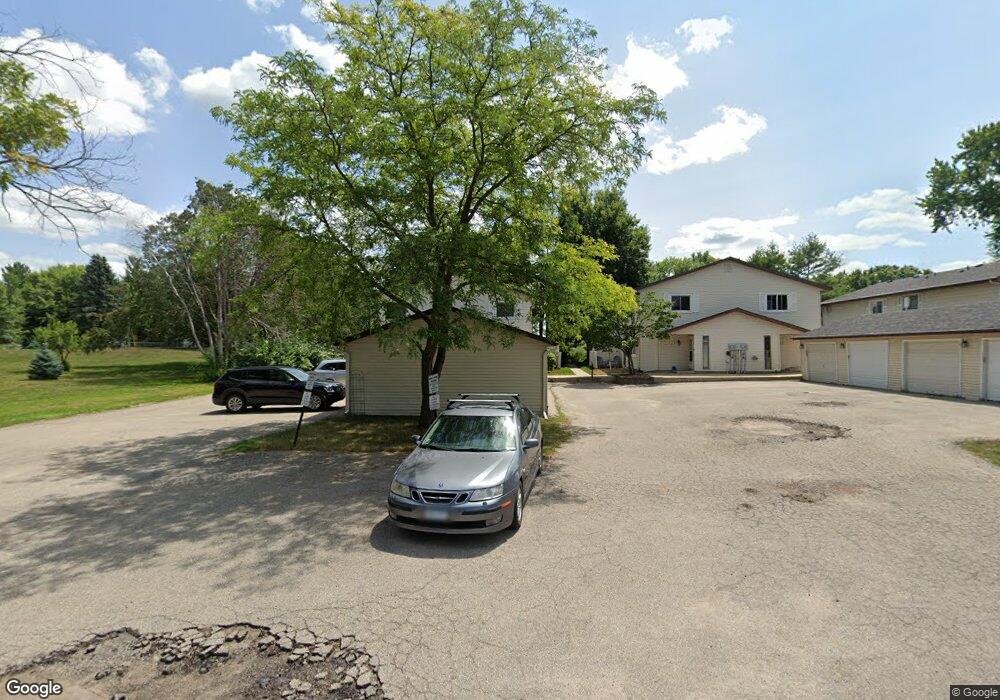
2014 31st Place NW Unit 12 Rochester, MN 55901
John Adams NeighborhoodEstimated Value: $161,609 - $179,000
2
Beds
2
Baths
1,040
Sq Ft
$166/Sq Ft
Est. Value
About This Home
This home is located at 2014 31st Place NW Unit 12, Rochester, MN 55901 and is currently estimated at $172,652, approximately $166 per square foot. 2014 31st Place NW Unit 12 is a home located in Olmsted County with nearby schools including Elton Hills Elementary School, John Adams Middle School, and John Marshall Senior High School.
Ownership History
Date
Name
Owned For
Owner Type
Purchase Details
Closed on
Aug 21, 2018
Sold by
Theis Jeffrey C and Theis Florence B
Bought by
Macdonald Brenda M
Current Estimated Value
Home Financials for this Owner
Home Financials are based on the most recent Mortgage that was taken out on this home.
Original Mortgage
$1,009,319
Outstanding Balance
$876,553
Interest Rate
4.5%
Mortgage Type
New Conventional
Estimated Equity
-$703,901
Purchase Details
Closed on
May 1, 2015
Bought by
Theis Jeffrey Jeffrey
Purchase Details
Closed on
Oct 29, 2004
Sold by
Ebner Lyle W
Bought by
Doty Walter T and Doty Mary
Home Financials for this Owner
Home Financials are based on the most recent Mortgage that was taken out on this home.
Original Mortgage
$84,000
Interest Rate
6%
Mortgage Type
Adjustable Rate Mortgage/ARM
Create a Home Valuation Report for This Property
The Home Valuation Report is an in-depth analysis detailing your home's value as well as a comparison with similar homes in the area
Home Values in the Area
Average Home Value in this Area
Purchase History
| Date | Buyer | Sale Price | Title Company |
|---|---|---|---|
| Macdonald Brenda M | $112,700 | Rochester Title & Escrow Co | |
| Theis Jeffrey Jeffrey | $82,500 | -- | |
| Doty Walter T | $89,800 | None Available |
Source: Public Records
Mortgage History
| Date | Status | Borrower | Loan Amount |
|---|---|---|---|
| Open | Macdonald Brenda M | $1,009,319 | |
| Previous Owner | Doty Walter T | $84,000 |
Source: Public Records
Tax History Compared to Growth
Tax History
| Year | Tax Paid | Tax Assessment Tax Assessment Total Assessment is a certain percentage of the fair market value that is determined by local assessors to be the total taxable value of land and additions on the property. | Land | Improvement |
|---|---|---|---|---|
| 2024 | $1,280 | $120,600 | $25,000 | $95,600 |
| 2023 | $1,234 | $120,600 | $25,000 | $95,600 |
| 2022 | $1,228 | $116,900 | $25,000 | $91,900 |
| 2021 | $1,170 | $112,600 | $25,000 | $87,600 |
| 2020 | $1,136 | $108,300 | $25,000 | $83,300 |
| 2019 | $894 | $103,100 | $25,000 | $78,100 |
| 2018 | $401 | $87,500 | $10,000 | $77,500 |
| 2017 | $742 | $81,000 | $5,000 | $76,000 |
| 2016 | $748 | $45,900 | $3,000 | $42,900 |
| 2015 | $541 | $45,800 | $3,000 | $42,800 |
| 2014 | $1,032 | $77,100 | $5,000 | $72,100 |
| 2012 | -- | $75,000 | $5,000 | $70,000 |
Source: Public Records
Map
Nearby Homes
- 3305 18th Ave NW
- 1840 36th St NW
- 3522 18th Ave NW
- XXX County Road 22
- 3925 18th Ave NW
- 3916 17th Ave NW
- 4017 18th Ave NW
- 4037 18th Ave NW
- 3012 Crescent Ln NW
- 2804 25th St NW
- xxx 41st St NW
- 2326 16th Ave NW
- 2021 22nd St NW
- 2408 22nd St NW
- 2858 25th St NW
- 4100 19 1 2 Ln NW
- 2855 24th St NW
- 1407 41st St NW
- 2043 42nd St NW
- 2509 11th Ave NW
- 2014 31st Place NW
- 2014 31st Place NW
- 2014 31st Place NW
- 2014 31st Place NW
- 2014 31st Place NW Unit 9
- 2014 31st Place NW Unit 10
- 2014 31st Place NW Unit 11
- 2020 31st Place NW
- 2020 31st Place NW
- 2020 31st Place NW
- 2020 31st Place NW
- 2020 31st Place NW
- 2020 31st Place NW Unit 7
- 2020 31st Place NW Unit 5
- 2020 31st Place NW Unit 6
- 2020 31st Place NW Unit 8
- 2014 2014 31st-Place-nw Unit 11
- 2014 2014 31st Place NW Unit 9
- 2014 2014 31st-Place-nw Unit 9
- 2026 31st Place NW