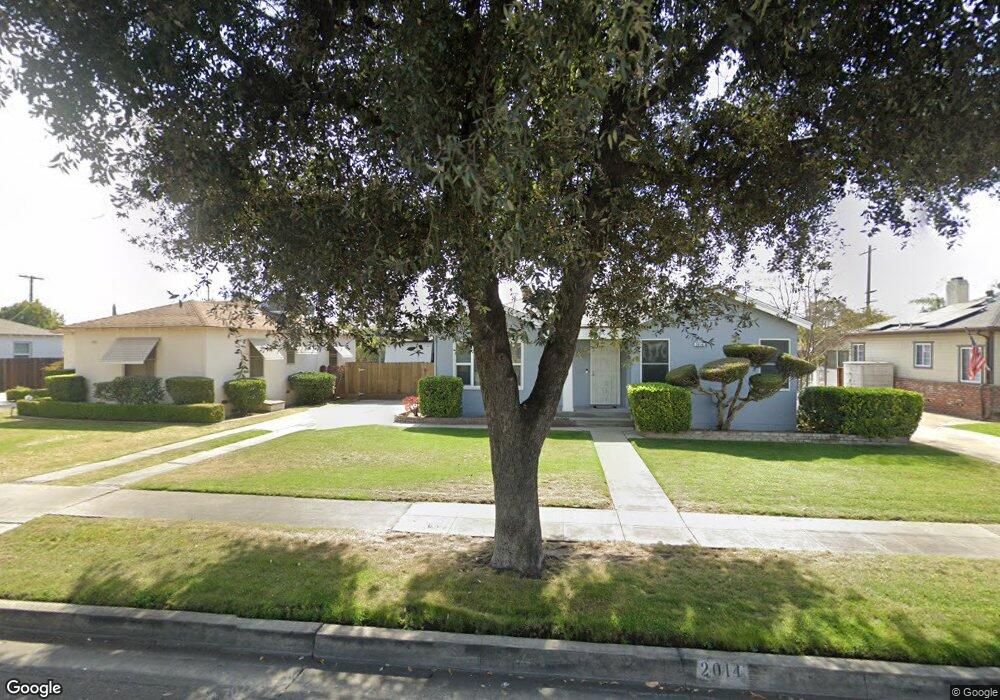
2014 E Princeton Ave Fresno, CA 93703
McLane NeighborhoodEstimated Value: $270,000 - $288,000
2
Beds
1
Bath
1,018
Sq Ft
$275/Sq Ft
Est. Value
About This Home
This home is located at 2014 E Princeton Ave, Fresno, CA 93703 and is currently estimated at $279,689, approximately $274 per square foot. 2014 E Princeton Ave is a home located in Fresno County with nearby schools including Birney Elementary School, Scandinavian Middle School, and Mclane High School.
Ownership History
Date
Name
Owned For
Owner Type
Purchase Details
Closed on
Sep 20, 2005
Sold by
Lingenfelter Thomas E
Bought by
Lingenfelter Thomas E and Lingenfelter Karen R
Current Estimated Value
Home Financials for this Owner
Home Financials are based on the most recent Mortgage that was taken out on this home.
Original Mortgage
$166,000
Outstanding Balance
$88,587
Interest Rate
5.81%
Mortgage Type
New Conventional
Estimated Equity
$191,102
Purchase Details
Closed on
Jun 3, 2003
Sold by
Hoffer Frances and Pasquale Barbara
Bought by
Lingenfelter Thomas E
Home Financials for this Owner
Home Financials are based on the most recent Mortgage that was taken out on this home.
Original Mortgage
$90,250
Interest Rate
5.6%
Mortgage Type
Purchase Money Mortgage
Create a Home Valuation Report for This Property
The Home Valuation Report is an in-depth analysis detailing your home's value as well as a comparison with similar homes in the area
Home Values in the Area
Average Home Value in this Area
Purchase History
We collect this data history from publicly available records. To have your information removed, we recommend requesting removal directly through your county’s website.
| Date | Buyer | Sale Price | Title Company |
|---|---|---|---|
| Lingenfelter Thomas E | -- | First American Title Ins Co | |
| Lingenfelter Thomas E | $95,000 | Chicago Title Company |
Source: Public Records
Mortgage History
We collect this data history from publicly available records. To have your information removed, we recommend requesting removal directly through your county’s website.
| Date | Status | Borrower | Loan Amount |
|---|---|---|---|
| Open | Lingenfelter Thomas E | $166,000 | |
| Previous Owner | Lingenfelter Thomas E | $90,250 |
Source: Public Records
Tax History
| Year | Tax Paid | Tax Assessment Tax Assessment Total Assessment is a certain percentage of the fair market value that is determined by local assessors to be the total taxable value of land and additions on the property. | Land | Improvement |
|---|---|---|---|---|
| 2025 | $1,770 | $135,051 | $25,582 | $109,469 |
| 2023 | $1,671 | $129,809 | $24,590 | $105,219 |
| 2022 | $1,648 | $127,264 | $24,108 | $103,156 |
| 2021 | $1,604 | $124,770 | $23,636 | $101,134 |
| 2020 | $1,540 | $119,000 | $22,200 | $96,800 |
| 2019 | $1,434 | $112,900 | $21,100 | $91,800 |
| 2018 | $1,403 | $110,700 | $20,700 | $90,000 |
| 2017 | $1,318 | $103,600 | $19,400 | $84,200 |
| 2016 | $1,239 | $98,700 | $18,500 | $80,200 |
| 2015 | $1,120 | $89,000 | $16,700 | $72,300 |
| 2014 | $1,049 | $83,400 | $15,700 | $67,700 |
Source: Public Records
Map
Nearby Homes
- 2244 E Princeton Ave
- 2026 E Hunter Ave
- 2233 E Terrace Ave
- 1946 E Clinton Ave
- 2305 E Shields Ave
- 1407 E Princeton Ave
- 2319 E Vassar Ave
- 2353 E Vassar Ave
- 1421 E Terrace Ave
- 2625 E Michigan Ave
- 3304 N Howard Ave
- 2704 E Michigan Ave
- 2218 N Glenn Ave
- 1211 E Clinton Ave
- 1250 E Vassar Ave
- 1044 E Cornell Ave
- 2901 E Princeton Ave
- 1007 E Michigan Ave
- 1328 E Fedora Ave
- 3004 N Maroa Ave
- 1945 E Princeton Ave
- 1937 E Princeton Ave
- 2005 E Princeton Ave
- 1931 E Princeton Ave
- 2011 E Princeton Ave
- 1946 E Michigan Ave
- 1921 E Princeton Ave
- 2019 E Princeton Ave
- 2006 E Michigan Ave
- 1936 E Michigan Ave
- 2012 E Michigan Ave
- 1926 E Michigan Ave
- 1940 E Princeton Ave
- 2004 E Princeton Ave
- 1911 E Princeton Ave
- 2027 E Princeton Ave
- 2020 E Michigan Ave
- 1920 E Princeton Ave
- 1916 E Michigan Ave
- 2028 E Michigan Ave
Your Personal Tour Guide
Ask me questions while you tour the home.