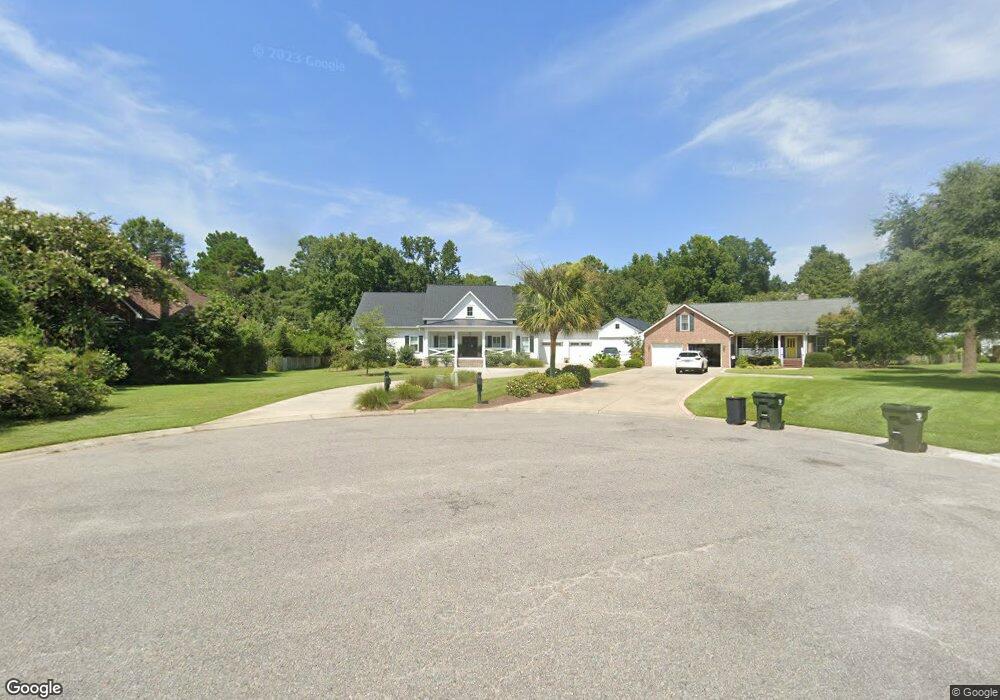
2014 Summerton Ct Pinopolis, SC 29469
Estimated Value: $477,000 - $793,000
Studio
--
Bath
2,658
Sq Ft
$212/Sq Ft
Est. Value
About This Home
This home is located at 2014 Summerton Ct, Pinopolis, SC 29469 and is currently estimated at $563,424, approximately $211 per square foot. 2014 Summerton Ct is a home located in Berkeley County with nearby schools including Berkeley Elementary School, Berkeley Middle School, and Berkeley High School.
Ownership History
Date
Name
Owned For
Owner Type
Purchase Details
Closed on
Jun 10, 2016
Sold by
Williams Thomas E and Williams Ann M
Bought by
Williams Ii John O and Williams Melissa H
Current Estimated Value
Purchase Details
Closed on
Jun 6, 2016
Sold by
Williams John B
Bought by
Williams Thomas E and Williams Ann M
Purchase Details
Closed on
Jun 1, 2011
Sold by
Williams Thomas E and Williams Ann M
Bought by
Williams John B
Purchase Details
Closed on
Aug 24, 2006
Sold by
Maultsby Arthur
Bought by
Williams Thomas E and Williams Ann M
Purchase Details
Closed on
Aug 22, 2006
Sold by
Greene Charles Drake
Bought by
Williams Thomas E and Williams Ann M
Purchase Details
Closed on
Aug 10, 2006
Sold by
Williams John B
Bought by
Williams Ann M and Harris Jane M
Purchase Details
Closed on
May 29, 2003
Sold by
Wilson Ronald D and Wilson Lisa Q
Bought by
Greene Jane M
Purchase Details
Closed on
Sep 6, 2002
Sold by
Janet Deavers Savage and Janet J
Bought by
Wilson Ronald D and Wilson Lisa Q
Create a Home Valuation Report for This Property
The Home Valuation Report is an in-depth analysis detailing your home's value as well as a comparison with similar homes in the area
Purchase History
| Date | Buyer | Sale Price | Title Company |
|---|---|---|---|
| Williams Ii John O | -- | -- | |
| Williams Thomas E | -- | -- | |
| Williams John B | -- | -- | |
| Williams Thomas E | $10,500 | None Available | |
| Williams Thomas E | $10,500 | None Available | |
| Williams Thomas E | $10,500 | None Available | |
| Williams Ann M | -- | None Available | |
| Greene Jane M | $45,000 | -- | |
| Wilson Ronald D | $45,000 | -- |
Source: Public Records
Tax History
| Year | Tax Paid | Tax Assessment Tax Assessment Total Assessment is a certain percentage of the fair market value that is determined by local assessors to be the total taxable value of land and additions on the property. | Land | Improvement |
|---|---|---|---|---|
| 2025 | $1,769 | $403,880 | $83,343 | $320,537 |
| 2024 | $1,705 | $403,880 | $83,343 | $320,537 |
| 2023 | $1,705 | $16,155 | $3,334 | $12,821 |
| 2022 | $1,665 | $14,048 | $1,932 | $12,116 |
| 2021 | $1,709 | $13,600 | $1,932 | $11,668 |
| 2020 | $1,731 | $13,600 | $1,932 | $11,668 |
| 2019 | $1,718 | $13,600 | $1,932 | $11,668 |
| 2018 | $705 | $2,520 | $2,520 | $0 |
| 2017 | $705 | $2,520 | $2,520 | $0 |
| 2016 | $1,264 | $3,600 | $3,600 | $0 |
| 2015 | $1,201 | $4,500 | $4,500 | $0 |
| 2014 | $1,121 | $4,500 | $4,500 | $0 |
| 2013 | -- | $4,500 | $4,500 | $0 |
Source: Public Records
Map
Nearby Homes
- 2030 W Lake Shore Dr
- 927 Fishburne Rd
- 2042 Pinopolis Rd
- 1420 Pinopolis Rd
- 310 Land O Pines Cir
- 124 Land O Pines Cir
- 627 Lakeside Dr
- 1554 Pinopolis Rd
- 601 Levee Dr
- 201 Summer Breeze Way
- 233 Harlock Dr
- 108 Themens Rd
- 112 Landerhill Ln
- 155 W End Dr
- 1051 Cooper Store Rd
- 120 Nazareth Ln
- 521 Hill St
- 263 Haynesville Extension
- 00 Haynesville Rd Extension
- 136 Morning View Way
- 2018 Summerton Ct
- 2010 Summerton Ct
- 2011 Shoreside Dr
- 2023 Summerton Ct
- 2007 Shoreside Dr
- 2006 Summerton Ct
- 2019 Summerton Ct
- 2015 Shoreside Dr
- 2005 Pinopolis Rd
- 2015 Summerton Ct
- 2011 Pinopolis Rd
- 2009 Summerton Ct
- 2037 W Lake Shore Dr
- 2045 W Lakeshore Dr
- 2045 W Lake Shore Dr
- 1941 Pinopolis Rd
- 2017 Pinopolis Rd
- 5550 Dias
- 2019 Shoreside Dr
- 1935 Pinopolis Rd
Your Personal Tour Guide
Ask me questions while you tour the home.