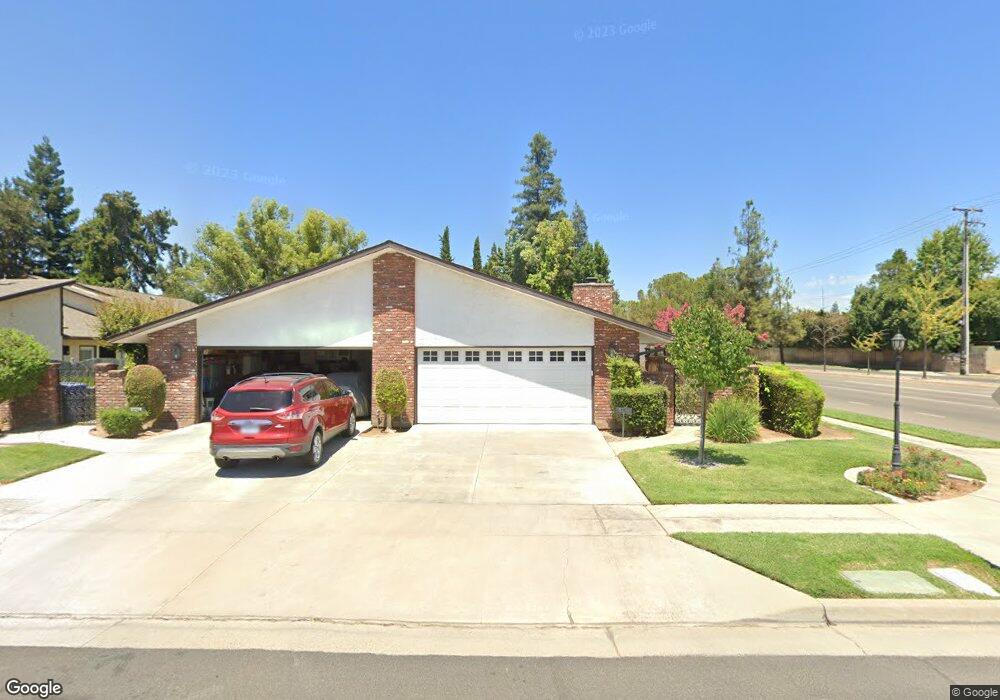
2014 W Calimyrna Ave Unit 14B Fresno, CA 93711
Van Ness Extension NeighborhoodEstimated Value: $338,000 - $365,000
3
Beds
2
Baths
1,852
Sq Ft
$191/Sq Ft
Est. Value
About This Home
This home is located at 2014 W Calimyrna Ave Unit 14B, Fresno, CA 93711 and is currently estimated at $354,645, approximately $191 per square foot. 2014 W Calimyrna Ave Unit 14B is a home located in Fresno County with nearby schools including Starr Elementary School, Tenaya Middle School, and Bullard High School.
Ownership History
Date
Name
Owned For
Owner Type
Purchase Details
Closed on
Aug 14, 2012
Sold by
Quinn Benita Elgorriaga
Bought by
Antonetti William J
Current Estimated Value
Home Financials for this Owner
Home Financials are based on the most recent Mortgage that was taken out on this home.
Original Mortgage
$132,000
Outstanding Balance
$90,579
Interest Rate
3.47%
Mortgage Type
New Conventional
Estimated Equity
$264,066
Purchase Details
Closed on
Dec 30, 2011
Sold by
Elgorriaga Esteban Bibiano and Quinn Benita Mary
Bought by
Quinn Benita Elgorriaga
Purchase Details
Closed on
Dec 1, 2006
Sold by
Andersen Benjamin F
Bought by
Mclaughlin Alice Marie and Alice Marie Mclaughlin Separate Property
Create a Home Valuation Report for This Property
The Home Valuation Report is an in-depth analysis detailing your home's value as well as a comparison with similar homes in the area
Home Values in the Area
Average Home Value in this Area
Purchase History
| Date | Buyer | Sale Price | Title Company |
|---|---|---|---|
| Antonetti William J | $165,000 | Fidelity National Title Co | |
| Quinn Benita Elgorriaga | -- | Fidelity National Title Co | |
| Quinn Benita Elgorriaga | -- | None Available | |
| Mclaughlin Alice Marie | $289,000 | Chicago Title Company |
Source: Public Records
Mortgage History
| Date | Status | Borrower | Loan Amount |
|---|---|---|---|
| Open | Antonetti William J | $132,000 |
Source: Public Records
Tax History Compared to Growth
Tax History
| Year | Tax Paid | Tax Assessment Tax Assessment Total Assessment is a certain percentage of the fair market value that is determined by local assessors to be the total taxable value of land and additions on the property. | Land | Improvement |
|---|---|---|---|---|
| 2025 | $2,649 | $203,171 | $50,482 | $152,689 |
| 2023 | $2,499 | $195,284 | $48,523 | $146,761 |
| 2022 | $2,465 | $191,456 | $47,572 | $143,884 |
| 2021 | $2,398 | $187,703 | $46,640 | $141,063 |
| 2020 | $2,388 | $185,779 | $46,162 | $139,617 |
| 2019 | $2,296 | $182,137 | $45,257 | $136,880 |
| 2018 | $2,246 | $178,567 | $44,370 | $134,197 |
| 2017 | $2,208 | $175,066 | $43,500 | $131,566 |
| 2016 | $2,135 | $171,635 | $42,648 | $128,987 |
| 2015 | $2,103 | $169,058 | $42,008 | $127,050 |
| 2014 | $2,062 | $165,748 | $41,186 | $124,562 |
Source: Public Records
Map
Nearby Homes
- 2073 W Calimyrna Ave Unit 101
- 1709 W Calimyrna Ave Unit 9A
- 5740 N West Ave Unit 109
- 2140 W Rue st Michel
- 2157 W Rue st Michel
- 2058 W Vartikian Ave
- 6067 N Teilman Ave
- 5811 N Forkner Ave
- 5649 N Romeo Ln
- 1545 W Calimyrna Ave
- 6060 N Van Ness Blvd
- 1486 W Roberts Ave
- 5554 N El Adobe Dr
- 1647 W Wrenwood Ave
- 1720 W Barstow Ave
- 1387 W Sample Ave
- 6518 N Dolores Ave
- 1646 W Paul Ave
- 1345 W Escalon Ave
- 1326 W Morris Ave
- 2014 W Calimyrna Ave
- 2026 W Calimyrna Ave
- 2026 W Calimyrna Ave Unit 13A
- 2038 W Calimyrna Ave Unit 101
- 2038 W Calimyrna Ave
- 1786 W Calimyrna Ave Unit 1A
- 1786 W Calimyrna Ave
- 1786 W Calimyrna Ave Unit 1B
- 2015 W Calimyrna Ave Unit 102
- 2015 W Calimyrna Ave Unit 101
- 2015 W Calimyrna Ave
- 2015 W Calimyrna Ave
- 2027 W Calimyrna Ave Unit 2B
- 2027 W Calimyrna Ave
- 2027 W Calimyrna Ave
- 2050 W Calimyrna Ave
- 2050 W Calimyrna Ave Unit 11A
- 2039 W Calimyrna Ave Unit 101
- 2039 W Calimyrna Ave Unit 102
- 2039 W Calimyrna Ave Unit 3B