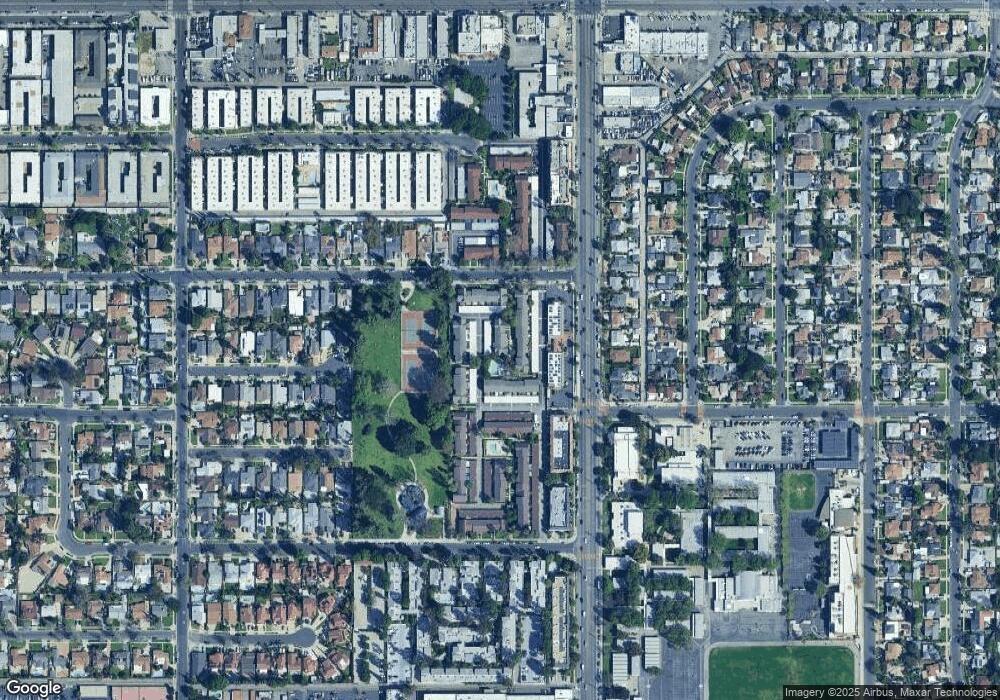
20140 Runnymede St Unit 39 Winnetka, CA 91306
Highlights
- In Ground Pool
- 129,194 Sq Ft lot
- Modern Architecture
- Valley Academy of Arts & Sciences Rated A-
- Wood Flooring
- 5-minute walk to Runnymede Park
About This Home
As of April 2024This home is located at 20140 Runnymede St Unit 39, Winnetka, CA 91306 and is currently priced at $367,500, approximately $274 per square foot. This property was built in 1974. 20140 Runnymede St Unit 39 is a home located in Los Angeles County with nearby schools including Stanley Mosk Elementary School, John A. Sutter Middle School, and Northridge Academy High.
Last Agent to Sell the Property
John Chowdhury
eXp Realty of California Inc License #01504627
Last Buyer's Agent
John Chowdhury
eXp Realty of California Inc License #01504627
Home Details
Home Type
- Single Family
Est. Annual Taxes
- $5,148
Year Built
- Built in 1974
Lot Details
- 2.97 Acre Lot
- Property is zoned LARD3
HOA Fees
- $400 Monthly HOA Fees
Parking
- 2 Car Garage
Home Design
- Modern Architecture
Interior Spaces
- 1,337 Sq Ft Home
- 2-Story Property
- Family Room
- Wood Flooring
Bedrooms and Bathrooms
- 2 Bedrooms
- 3 Full Bathrooms
Additional Features
- In Ground Pool
- Central Heating and Cooling System
Listing and Financial Details
- Assessor Parcel Number 2114-012-037
Community Details
Overview
- Association fees include earthquake insurance
- Association Phone (818) 382-7300
Recreation
- Community Pool
Ownership History
Purchase Details
Home Financials for this Owner
Home Financials are based on the most recent Mortgage that was taken out on this home.Purchase Details
Home Financials for this Owner
Home Financials are based on the most recent Mortgage that was taken out on this home.Purchase Details
Purchase Details
Purchase Details
Home Financials for this Owner
Home Financials are based on the most recent Mortgage that was taken out on this home.Purchase Details
Purchase Details
Home Financials for this Owner
Home Financials are based on the most recent Mortgage that was taken out on this home.Purchase Details
Home Financials for this Owner
Home Financials are based on the most recent Mortgage that was taken out on this home.Map
Home Values in the Area
Average Home Value in this Area
Purchase History
| Date | Type | Sale Price | Title Company |
|---|---|---|---|
| Grant Deed | $560,000 | 805Title Inc | |
| Grant Deed | $367,500 | Fidelity National Title | |
| Grant Deed | $192,000 | North American Title | |
| Trustee Deed | $157,500 | None Available | |
| Interfamily Deed Transfer | -- | Ticor Title Co Glendale | |
| Interfamily Deed Transfer | -- | Accommodation | |
| Grant Deed | $238,000 | Fidelity | |
| Individual Deed | $153,000 | Investors Title Company |
Mortgage History
| Date | Status | Loan Amount | Loan Type |
|---|---|---|---|
| Open | $50,000 | New Conventional | |
| Previous Owner | $322,500 | New Conventional | |
| Previous Owner | $330,750 | New Conventional | |
| Previous Owner | $30,000 | Credit Line Revolving | |
| Previous Owner | $230,000 | Stand Alone Refi Refinance Of Original Loan | |
| Previous Owner | $185,900 | New Conventional | |
| Previous Owner | $50,000 | Unknown | |
| Previous Owner | $192,000 | Unknown | |
| Previous Owner | $340,000 | Balloon | |
| Previous Owner | $248,000 | Unknown | |
| Previous Owner | $214,200 | No Value Available | |
| Previous Owner | $148,410 | FHA | |
| Previous Owner | $148,410 | FHA |
Property History
| Date | Event | Price | Change | Sq Ft Price |
|---|---|---|---|---|
| 04/02/2024 04/02/24 | Sold | $560,000 | +5.7% | $419 / Sq Ft |
| 03/07/2024 03/07/24 | Pending | -- | -- | -- |
| 03/06/2024 03/06/24 | For Sale | $530,000 | +44.2% | $396 / Sq Ft |
| 05/25/2018 05/25/18 | Sold | $367,500 | +5.0% | $275 / Sq Ft |
| 04/30/2018 04/30/18 | Pending | -- | -- | -- |
| 04/27/2018 04/27/18 | For Sale | $350,000 | -- | $262 / Sq Ft |
Tax History
| Year | Tax Paid | Tax Assessment Tax Assessment Total Assessment is a certain percentage of the fair market value that is determined by local assessors to be the total taxable value of land and additions on the property. | Land | Improvement |
|---|---|---|---|---|
| 2024 | $5,148 | $409,948 | $243,515 | $166,433 |
| 2023 | $5,050 | $401,911 | $238,741 | $163,170 |
| 2022 | $4,817 | $394,031 | $234,060 | $159,971 |
| 2021 | $4,754 | $386,306 | $229,471 | $156,835 |
| 2019 | $4,613 | $374,850 | $222,666 | $152,184 |
| 2018 | $2,664 | $216,183 | $69,695 | $146,488 |
| 2017 | $2,603 | $211,945 | $68,329 | $143,616 |
| 2016 | $2,531 | $207,790 | $66,990 | $140,800 |
| 2015 | $2,494 | $204,670 | $65,984 | $138,686 |
| 2014 | $2,508 | $200,662 | $64,692 | $135,970 |
Source: The MLS
MLS Number: 18-338116
APN: 2114-012-037
- 20134 Leadwell St Unit 130
- 20134 Leadwell St Unit 217
- 20146 Cohasset St Unit 15
- 20246 Cohasset St Unit 4
- 20234 Cohasset St Unit 11
- 20159 Cohasset St Unit 7
- 7445 Oakdale Ave
- 7640 Oso Ave Unit 217
- 7640 Oso Ave Unit 219
- 20235 Keswick St Unit 121
- 20235 Keswick St Unit 102
- 20155 Keswick St Unit 117
- 20155 Keswick St Unit 209
- 20327 Saticoy St Unit 205
- 20253 Keswick St Unit 326
- 20253 Keswick St Unit 109
- 19950 Sherman Way Unit A
- 7661 Penfield Ave
- 20224 Sherman Way Unit 28
- 20118 Elkwood St
