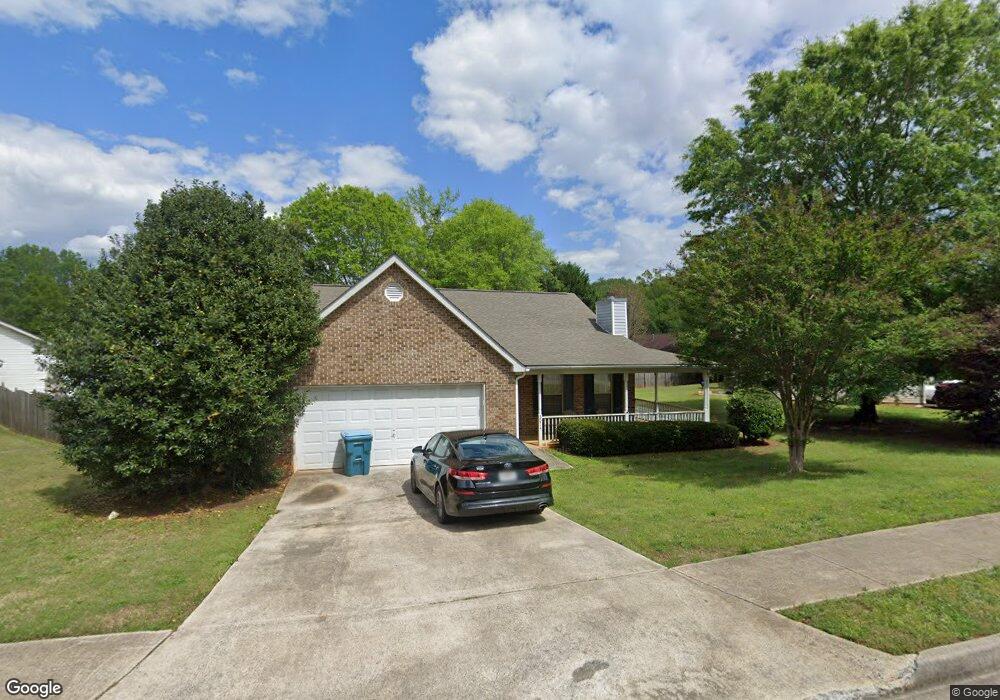
2015 Elm Grove Ln Hampton, GA 30228
Estimated Value: $238,000 - $258,000
3
Beds
2
Baths
1,528
Sq Ft
$164/Sq Ft
Est. Value
About This Home
This home is located at 2015 Elm Grove Ln, Hampton, GA 30228 and is currently estimated at $249,980, approximately $163 per square foot. 2015 Elm Grove Ln is a home located in Henry County with nearby schools including Rocky Creek Elementary School, Hampton Middle School, and Hampton High School.
Ownership History
Date
Name
Owned For
Owner Type
Purchase Details
Closed on
Feb 25, 2008
Sold by
Fowler Lakisha D
Bought by
Dixson Lakisha F
Current Estimated Value
Home Financials for this Owner
Home Financials are based on the most recent Mortgage that was taken out on this home.
Original Mortgage
$132,356
Outstanding Balance
$80,831
Interest Rate
5.46%
Mortgage Type
FHA
Estimated Equity
$169,149
Purchase Details
Closed on
Aug 11, 2006
Sold by
Fleshman Stacle M
Bought by
Fowler Lakisha D
Home Financials for this Owner
Home Financials are based on the most recent Mortgage that was taken out on this home.
Original Mortgage
$126,760
Interest Rate
6.67%
Mortgage Type
FHA
Purchase Details
Closed on
Jun 26, 2003
Sold by
Den-Ric Corp
Bought by
Fleshman Stacie M
Home Financials for this Owner
Home Financials are based on the most recent Mortgage that was taken out on this home.
Original Mortgage
$118,650
Interest Rate
5.16%
Mortgage Type
New Conventional
Create a Home Valuation Report for This Property
The Home Valuation Report is an in-depth analysis detailing your home's value as well as a comparison with similar homes in the area
Home Values in the Area
Average Home Value in this Area
Purchase History
| Date | Buyer | Sale Price | Title Company |
|---|---|---|---|
| Dixson Lakisha F | -- | -- | |
| Fowler Lakisha D | $128,800 | -- | |
| Fleshman Stacie M | $122,300 | -- |
Source: Public Records
Mortgage History
| Date | Status | Borrower | Loan Amount |
|---|---|---|---|
| Open | Dixson Lakisha F | $132,356 | |
| Previous Owner | Fowler Lakisha D | $126,760 | |
| Previous Owner | Fleshman Stacie M | $118,650 |
Source: Public Records
Tax History
| Year | Tax Paid | Tax Assessment Tax Assessment Total Assessment is a certain percentage of the fair market value that is determined by local assessors to be the total taxable value of land and additions on the property. | Land | Improvement |
|---|---|---|---|---|
| 2025 | $3,491 | $116,480 | $12,000 | $104,480 |
| 2024 | $3,491 | $104,960 | $12,000 | $92,960 |
| 2023 | $2,538 | $97,920 | $10,000 | $87,920 |
| 2022 | $2,700 | $81,080 | $10,000 | $71,080 |
| 2021 | $1,961 | $65,160 | $10,000 | $55,160 |
| 2020 | $1,844 | $60,200 | $10,000 | $50,200 |
| 2019 | $1,720 | $54,000 | $8,000 | $46,000 |
| 2018 | $1,638 | $51,480 | $8,000 | $43,480 |
| 2016 | $1,450 | $46,400 | $4,800 | $41,600 |
| 2015 | $1,642 | $50,400 | $4,800 | $45,600 |
| 2014 | $978 | $32,680 | $4,800 | $27,880 |
Source: Public Records
Map
Nearby Homes
- 2025 Elm Grove Ln
- 1903 Elm Park Dr
- 21 Elm St
- 248 Fern Ct
- 13 Derrick St
- 28 Elm St
- 55 Porter Cir
- 6 Derrick St
- 42 Elm St
- 32 Mcdonough St
- 48 Magnolia Pkwy
- 220 Windpher Ridge
- 25 Georgia Ave
- 38 Mcdonough St
- 252 Sandstone Dr
- 10 Plum Blossom Ln
- 260 Sandstone Dr
- 120 Caldwell Dr
- 120 Bridgemill Dr
- 80 Knolls Ridge
- 2009 Elm Grove Ln
- 2019 Elm Grove Ln
- 2005 Elm Grove Ln
- 2023 Elm Grove Ln
- 2014 Elm Grove Ln
- 2016 Elm Grove Ln
- 2018 Elm Grove Ln
- 2003 Elm Grove Ln
- 2008 Elm Grove Ln
- 2020 Elm Grove Ln
- 2020 Elm Grove Ln
- 2010 Elm Grove Ln
- 2029 Elm Grove Ln
- 1911 Elm Park Dr
- 2000 Elm Grove Ln
- 2024 Elm Grove Ln
- 2001 Elm Grove Ln
- 2006 Elm Grove Ln
- 2006 Elm Grove Ln Unit 24
- 1810 Ulmus Ct
Your Personal Tour Guide
Ask me questions while you tour the home.