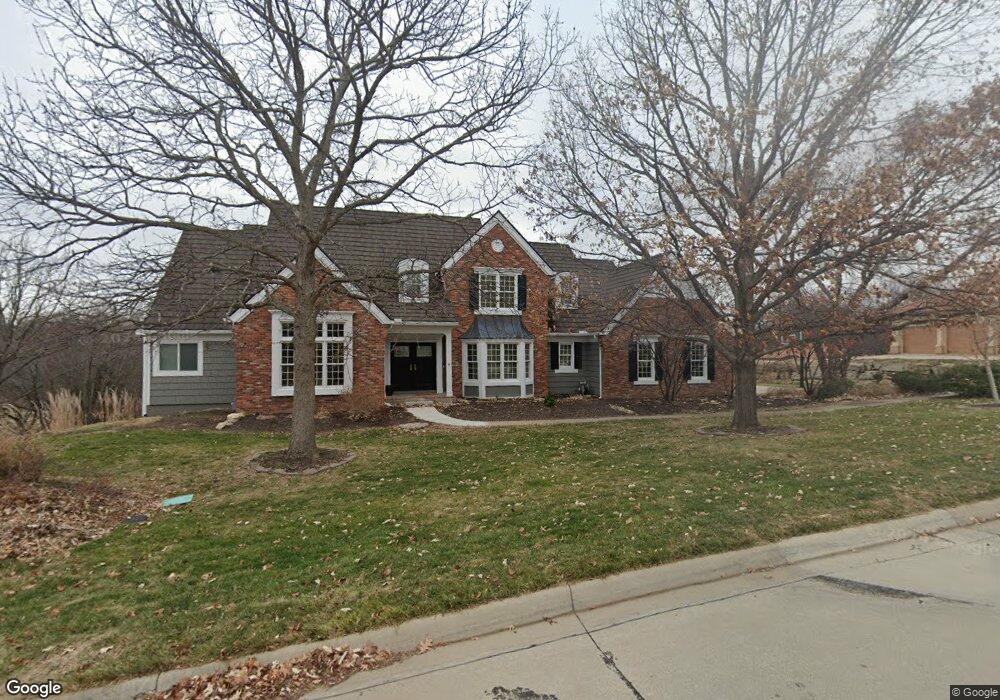
2015 Hogan Dr Lawrence, KS 66047
Estimated Value: $1,374,000 - $1,652,000
5
Beds
6
Baths
5,850
Sq Ft
$258/Sq Ft
Est. Value
About This Home
This home is located at 2015 Hogan Dr, Lawrence, KS 66047 and is currently estimated at $1,511,957, approximately $258 per square foot. 2015 Hogan Dr is a home located in Douglas County with nearby schools including Sunflower Elementary School, Southwest Middle School, and Lawrence High School.
Ownership History
Date
Name
Owned For
Owner Type
Purchase Details
Closed on
Mar 7, 2023
Sold by
Sheldon Christopher P and Sheldon Megan E
Bought by
Chahine Megan E and Chahine Hatem B
Current Estimated Value
Home Financials for this Owner
Home Financials are based on the most recent Mortgage that was taken out on this home.
Original Mortgage
$781,000
Outstanding Balance
$754,726
Interest Rate
6.32%
Mortgage Type
New Conventional
Estimated Equity
$757,231
Purchase Details
Closed on
Mar 3, 2011
Sold by
The Trust Company Of Kansas
Bought by
Partee Andrea and Jones Wesley E
Purchase Details
Closed on
Nov 24, 2003
Sold by
Honse Robert W
Bought by
Partee Randy L and Partee Andrea L
Home Financials for this Owner
Home Financials are based on the most recent Mortgage that was taken out on this home.
Original Mortgage
$567,200
Interest Rate
3.75%
Mortgage Type
Purchase Money Mortgage
Create a Home Valuation Report for This Property
The Home Valuation Report is an in-depth analysis detailing your home's value as well as a comparison with similar homes in the area
Purchase History
| Date | Buyer | Sale Price | Title Company |
|---|---|---|---|
| Chahine Megan E | -- | Security 1St Title | |
| Partee Andrea | -- | None Available | |
| Partee Randy L | -- | Commerce Title |
Source: Public Records
Mortgage History
| Date | Status | Borrower | Loan Amount |
|---|---|---|---|
| Open | Chahine Megan E | $781,000 | |
| Previous Owner | Partee Randy L | $567,200 |
Source: Public Records
Tax History
| Year | Tax Paid | Tax Assessment Tax Assessment Total Assessment is a certain percentage of the fair market value that is determined by local assessors to be the total taxable value of land and additions on the property. | Land | Improvement |
|---|---|---|---|---|
| 2025 | $22,931 | $180,177 | $18,400 | $161,777 |
| 2024 | $22,327 | $175,364 | $18,400 | $156,964 |
| 2023 | $15,542 | $119,267 | $18,400 | $100,867 |
| 2022 | $15,109 | $115,162 | $18,435 | $96,727 |
| 2021 | $14,840 | $110,227 | $18,394 | $91,833 |
| 2020 | $14,592 | $108,939 | $18,394 | $90,545 |
| 2019 | $14,207 | $106,180 | $17,227 | $88,953 |
| 2018 | $14,281 | $105,950 | $16,100 | $89,850 |
| 2017 | $14,188 | $104,087 | $16,100 | $87,987 |
| 2016 | $14,824 | $113,536 | $16,100 | $97,436 |
| 2015 | $12,085 | $92,610 | $16,100 | $76,510 |
| 2014 | $11,969 | $92,610 | $16,100 | $76,510 |
Source: Public Records
Map
Nearby Homes
- 1900 Inverness Dr
- 4206 Nicklaus Dr
- 4500 Turnberry Dr
- 4412 Nicklaus Dr
- 2101 Riviera Dr
- 1908 Crossgate Dr
- 2018 Crossgate Dr
- 1609 Prestwick Dr
- 4720 Carmel Place
- 3700 Quail Creek Ct
- 4712 Balmoral Dr
- 1503 Crossgate Dr
- 4206 Teal Dr
- 1501 Crossgate Dr
- 4142 Blackjack Oak Dr
- 1840 Quail Creek Dr
- 1407 Brighton Cir
- 1606 Cypress Point Dr
- 2615 Red Cedar Dr
- 4900 Stoneback Dr
- 2011 Hogan Dr
- 2019 Hogan Dr
- 2010 Hogan Dr
- 2018 Hogan Dr
- 2023 Hogan Dr
- 2007 Hogan Dr
- 2015 Palmer Dr
- 2006 Hogan Dr
- 2011 Palmer Dr
- 2012 Inverness Dr
- 4301 Nicklaus Dr
- 2100 Inverness Dr
- 2028 Palmer Dr
- 2027 Hogan Ct
- 2024 Palmer Dr
- 4305 Nicklaus Dr
- 2002 Hogan Dr
- 2032 Hogan Ct
- 2020 Palmer Dr
- 2104 Inverness Dr
Your Personal Tour Guide
Ask me questions while you tour the home.