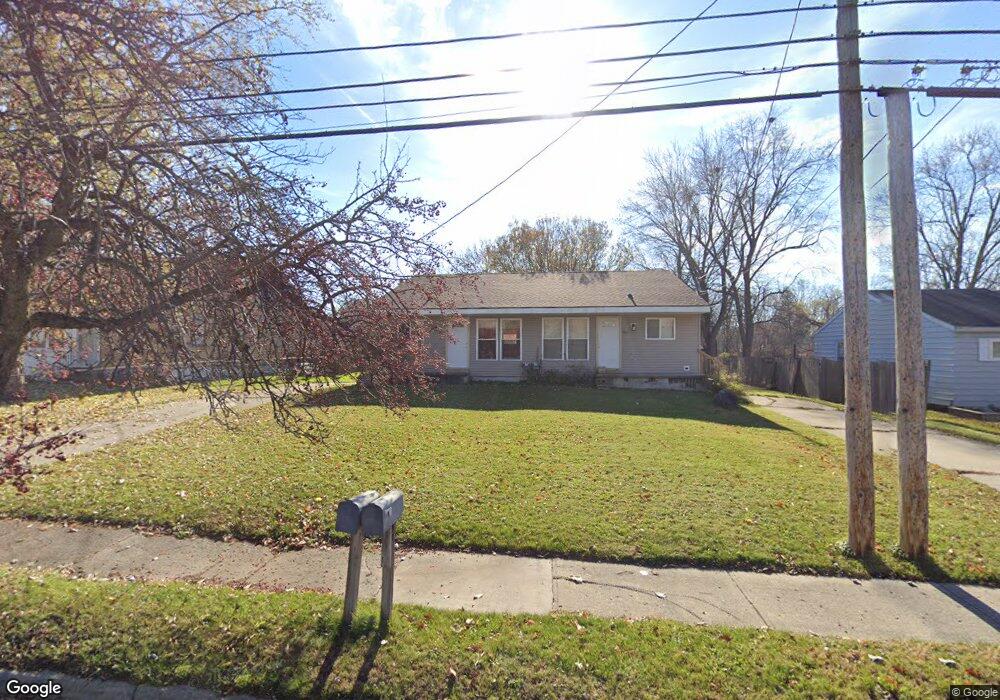
2015 W Jolly Rd Lansing, MI 48910
Southern Lansing NeighborhoodEstimated Value: $159,000 - $195,000
--
Bed
1
Bath
1,848
Sq Ft
$95/Sq Ft
Est. Value
About This Home
This home is located at 2015 W Jolly Rd, Lansing, MI 48910 and is currently estimated at $174,695, approximately $94 per square foot. 2015 W Jolly Rd is a home located in Ingham County with nearby schools including Reo Elementary School, Attwood School, and Everett High School.
Ownership History
Date
Name
Owned For
Owner Type
Purchase Details
Closed on
Mar 6, 2023
Sold by
Kruger Bruce W
Bought by
Kruger Bruce W
Current Estimated Value
Purchase Details
Closed on
Dec 12, 2003
Sold by
Kruger Properties Inc
Bought by
Kruger Bruce
Home Financials for this Owner
Home Financials are based on the most recent Mortgage that was taken out on this home.
Original Mortgage
$94,500
Interest Rate
5.91%
Mortgage Type
Purchase Money Mortgage
Purchase Details
Closed on
Oct 1, 1998
Sold by
Kruger Bruce W and Kruger Patti
Bought by
Kruger Bruce W
Home Financials for this Owner
Home Financials are based on the most recent Mortgage that was taken out on this home.
Original Mortgage
$55,250
Interest Rate
9.49%
Mortgage Type
Purchase Money Mortgage
Create a Home Valuation Report for This Property
The Home Valuation Report is an in-depth analysis detailing your home's value as well as a comparison with similar homes in the area
Home Values in the Area
Average Home Value in this Area
Purchase History
| Date | Buyer | Sale Price | Title Company |
|---|---|---|---|
| Kruger Bruce W | -- | None Listed On Document | |
| Kruger Bruce W | -- | None Listed On Document | |
| Kruger Bruce | -- | -- | |
| Kruger Bruce W | -- | Midstate Title Company |
Source: Public Records
Mortgage History
| Date | Status | Borrower | Loan Amount |
|---|---|---|---|
| Previous Owner | Kruger Bruce | $94,500 | |
| Previous Owner | Kruger Bruce W | $55,250 |
Source: Public Records
Tax History Compared to Growth
Tax History
| Year | Tax Paid | Tax Assessment Tax Assessment Total Assessment is a certain percentage of the fair market value that is determined by local assessors to be the total taxable value of land and additions on the property. | Land | Improvement |
|---|---|---|---|---|
| 2025 | $4,205 | $84,800 | $9,000 | $75,800 |
| 2024 | $34 | $88,300 | $9,000 | $79,300 |
| 2023 | $3,960 | $84,500 | $9,000 | $75,500 |
| 2022 | $3,620 | $49,600 | $5,800 | $43,800 |
| 2021 | $3,537 | $48,200 | $5,600 | $42,600 |
| 2020 | $3,511 | $48,200 | $5,600 | $42,600 |
| 2019 | $3,389 | $48,500 | $5,600 | $42,900 |
| 2018 | $3,217 | $41,300 | $5,600 | $35,700 |
| 2017 | $3,182 | $41,300 | $5,600 | $35,700 |
| 2016 | $4,123 | $40,600 | $5,600 | $35,000 |
| 2015 | $4,123 | $53,500 | $11,174 | $42,326 |
| 2014 | $4,123 | $54,900 | $18,157 | $36,743 |
Source: Public Records
Map
Nearby Homes
- 0 Midwood St
- 4620 Christiansen Rd
- 2045 Moffitt St
- 4628 Pleasant Grove Rd
- 2416 Midwood St
- 4916 Tressa Dr
- 1729 Reo Rd
- 1324 N Briarfield Dr
- 4828 Ingham St
- 1415 Reo Rd
- 1420 Reo Rd
- 1429 Pierce Rd
- 1500 Pierce Rd
- 1422 Pierce Rd
- 4809 Ballard Rd
- 4110 Richmond St
- 0 W Jolly Rd
- 2311 Greenbelt Dr
- 4017 Richmond St
- 5838 S Martin Luther King Junior Blvd