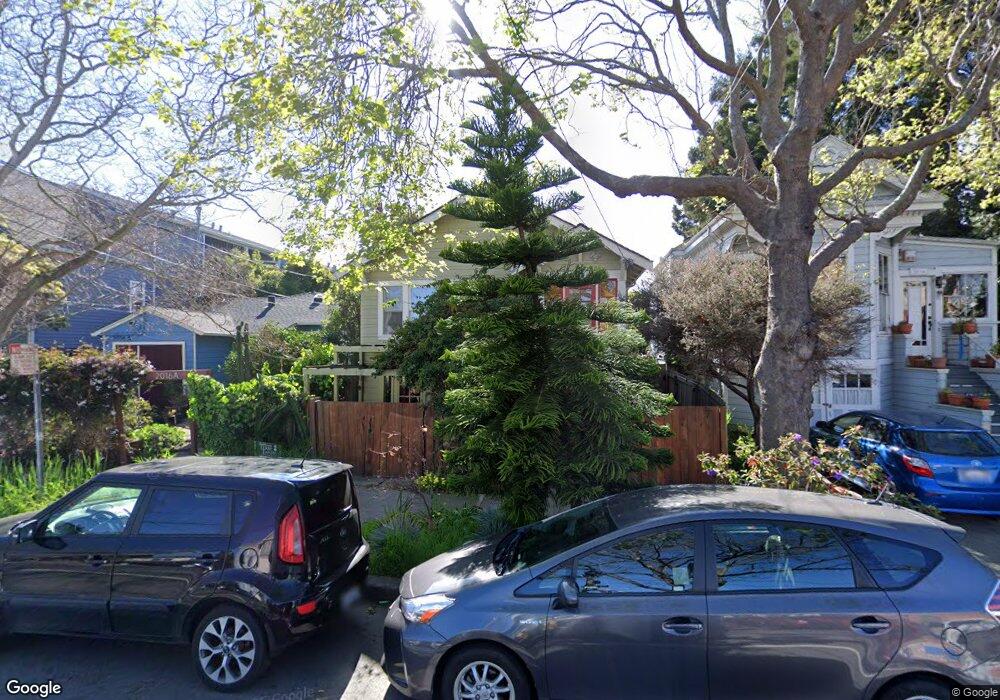
2016 9th St Berkeley, CA 94710
West Berkeley NeighborhoodEstimated Value: $1,082,000 - $1,270,918
2
Beds
2
Baths
1,218
Sq Ft
$969/Sq Ft
Est. Value
About This Home
This home is located at 2016 9th St, Berkeley, CA 94710 and is currently estimated at $1,179,730, approximately $968 per square foot. 2016 9th St is a home located in Alameda County with nearby schools including Rosa Parks Elementary School, Ruth Acty Elementary, and Berkeley Arts Magnet at Whittier School.
Ownership History
Date
Name
Owned For
Owner Type
Purchase Details
Closed on
Dec 27, 2021
Sold by
Thomas Garland Eric
Bought by
Caltvedt Sonia and Garland Eric
Current Estimated Value
Home Financials for this Owner
Home Financials are based on the most recent Mortgage that was taken out on this home.
Original Mortgage
$100,000
Outstanding Balance
$89,522
Interest Rate
3.75%
Mortgage Type
Credit Line Revolving
Estimated Equity
$1,090,208
Purchase Details
Closed on
Jun 22, 2018
Sold by
Bojko Stefan T and Carlberg Katie T
Bought by
Garland Eric Thomas and Caltvedt Sonia Catherine
Purchase Details
Closed on
Jul 28, 2016
Sold by
Wells Vita and The Michelle M Bertho Revocabl
Bought by
Bojko Stefan T and Carlberg Katie T
Home Financials for this Owner
Home Financials are based on the most recent Mortgage that was taken out on this home.
Original Mortgage
$625,000
Interest Rate
3.48%
Mortgage Type
New Conventional
Purchase Details
Closed on
Jul 17, 2013
Sold by
Bertho Michelle
Bought by
Bertho Michelle and Michelle M Bertho Revocable Tr
Purchase Details
Closed on
Mar 12, 2003
Sold by
Davidson Philip Lee
Bought by
Bertho Michelle
Home Financials for this Owner
Home Financials are based on the most recent Mortgage that was taken out on this home.
Original Mortgage
$285,000
Interest Rate
5.83%
Create a Home Valuation Report for This Property
The Home Valuation Report is an in-depth analysis detailing your home's value as well as a comparison with similar homes in the area
Home Values in the Area
Average Home Value in this Area
Purchase History
| Date | Buyer | Sale Price | Title Company |
|---|---|---|---|
| Caltvedt Sonia | -- | Placer Title | |
| Garland Eric Thomas | $995,000 | Chicago Title Company | |
| Bojko Stefan T | $932,000 | Placer Title Company | |
| Bertho Michelle | -- | None Available | |
| Bertho Michelle | $435,000 | First American Title Company | |
| Davidson Philip Lee | -- | First American Title Company |
Source: Public Records
Mortgage History
| Date | Status | Borrower | Loan Amount |
|---|---|---|---|
| Open | Caltvedt Sonia | $100,000 | |
| Previous Owner | Bojko Stefan T | $625,000 | |
| Previous Owner | Bertho Michelle | $285,000 |
Source: Public Records
Tax History
| Year | Tax Paid | Tax Assessment Tax Assessment Total Assessment is a certain percentage of the fair market value that is determined by local assessors to be the total taxable value of land and additions on the property. | Land | Improvement |
|---|---|---|---|---|
| 2025 | $15,492 | $1,102,922 | $557,750 | $552,172 |
| 2024 | $15,492 | $1,081,161 | $546,815 | $541,346 |
| 2023 | $15,186 | $1,066,829 | $536,095 | $530,734 |
| 2022 | $14,950 | $1,038,914 | $525,585 | $520,329 |
| 2021 | $15,006 | $1,018,407 | $515,280 | $510,127 |
| 2020 | $14,297 | $1,014,900 | $510,000 | $504,900 |
| 2019 | $13,855 | $995,000 | $500,000 | $495,000 |
| 2018 | $13,408 | $950,640 | $285,192 | $665,448 |
| 2017 | $12,947 | $932,000 | $279,600 | $652,400 |
| 2016 | $7,873 | $532,183 | $159,655 | $372,528 |
| 2015 | $7,767 | $524,191 | $157,257 | $366,934 |
| 2014 | $7,710 | $513,925 | $154,177 | $359,748 |
Source: Public Records
Map
Nearby Homes
- 2013 9th St
- 1050 Allston Way
- 940 Delaware St
- 2220 7th St
- 2241 Ninth St
- 931 Bancroft Way
- 817 Delaware St
- 2238 7th St
- 1128 Delaware St
- 2144 Curtis St
- 1919 Curtis St
- 2231 Byron St
- 995 Virginia St
- 2327 10th St Unit 4
- 1728 Curtis St
- 1039 Channing Way
- 1261 Hearst Ave
- 2324 Browning St
- 1631 Belvedere Ave
- 1092 Dwight Way
- 2016 9th St Unit A&B
- 2016 9th St
- 2014 9th St
- 2010 9th St
- 2012 9th St
- 2008 9th St
- 2022 9th St
- 2015 8th St
- 2017 8th St
- 2026 9th St Unit 2026
- 2018 Ninth St Unit D
- 2018 9th St Unit H
- 2018 9th St Unit E
- 2018 9th St Unit B
- 2018 9th St Unit G
- 2018 9th St Unit D
- 2018 9th St Unit F
- 2018 9th St Unit C
- 2018 9th St Unit A
- 2011 8th St
Your Personal Tour Guide
Ask me questions while you tour the home.