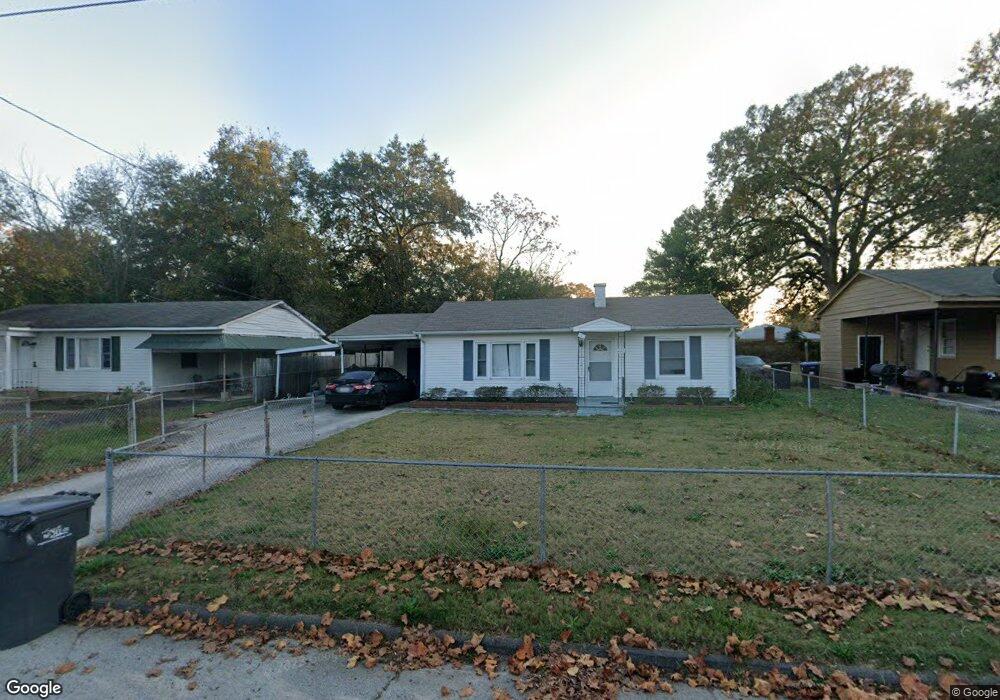
2016 Dunham Ct Augusta, GA 30906
Old Savannah NeighborhoodEstimated Value: $110,607 - $122,000
3
Beds
1
Bath
925
Sq Ft
$126/Sq Ft
Est. Value
About This Home
This home is located at 2016 Dunham Ct, Augusta, GA 30906 and is currently estimated at $116,152, approximately $125 per square foot. 2016 Dunham Ct is a home located in Richmond County with nearby schools including Hains Elementary School, Richmond Hill K-8, and Johnson Magnet.
Ownership History
Date
Name
Owned For
Owner Type
Purchase Details
Closed on
Jan 29, 2021
Sold by
Rogers Jeanie C
Bought by
Majors Christopher
Current Estimated Value
Home Financials for this Owner
Home Financials are based on the most recent Mortgage that was taken out on this home.
Original Mortgage
$30,000
Interest Rate
2.6%
Mortgage Type
New Conventional
Purchase Details
Closed on
Aug 23, 2001
Sold by
Rogers Jeanie C
Bought by
Rogers Patrick
Home Financials for this Owner
Home Financials are based on the most recent Mortgage that was taken out on this home.
Original Mortgage
$35,000
Interest Rate
7.08%
Mortgage Type
Stand Alone Second
Purchase Details
Closed on
Oct 1, 1993
Sold by
Hawkins Dorothy Vio
Bought by
Rogers Jeanie C
Purchase Details
Closed on
Sep 17, 1993
Sold by
Hawkins Leemon Edward and Hawkins Est
Bought by
Hawkins Dorothy Viola Tinsley Dorot
Create a Home Valuation Report for This Property
The Home Valuation Report is an in-depth analysis detailing your home's value as well as a comparison with similar homes in the area
Home Values in the Area
Average Home Value in this Area
Purchase History
| Date | Buyer | Sale Price | Title Company |
|---|---|---|---|
| Majors Christopher | $35,000 | -- | |
| Rogers Patrick | -- | -- | |
| Rogers Jeanie C | $44,900 | -- | |
| Hawkins Dorothy Viola Tinsley Dorot | -- | -- |
Source: Public Records
Mortgage History
| Date | Status | Borrower | Loan Amount |
|---|---|---|---|
| Closed | Majors Christopher | $30,000 | |
| Previous Owner | Rogers Patrick | $35,000 |
Source: Public Records
Tax History
| Year | Tax Paid | Tax Assessment Tax Assessment Total Assessment is a certain percentage of the fair market value that is determined by local assessors to be the total taxable value of land and additions on the property. | Land | Improvement |
|---|---|---|---|---|
| 2025 | $1,681 | $45,060 | $4,800 | $40,260 |
| 2024 | $1,681 | $36,996 | $4,800 | $32,196 |
| 2023 | $1,394 | $35,612 | $4,800 | $30,812 |
| 2022 | $788 | $14,000 | $2,040 | $11,960 |
| 2021 | $548 | $18,158 | $4,800 | $13,358 |
| 2020 | $550 | $18,158 | $4,800 | $13,358 |
| 2019 | $561 | $18,158 | $4,800 | $13,358 |
| 2018 | $825 | $18,158 | $4,800 | $13,358 |
| 2017 | $765 | $18,158 | $4,800 | $13,358 |
| 2016 | $765 | $18,158 | $4,800 | $13,358 |
| 2015 | $769 | $18,158 | $4,800 | $13,358 |
| 2014 | $769 | $18,158 | $4,800 | $13,358 |
Source: Public Records
Map
Nearby Homes
- 2019 Dunham Ct
- 3207 Gerald Dr E
- 2126 Harding Rd
- 1825 Medlar St
- 1914 Collierwood Way
- 1918 Kings Grant Dr
- 1822 Catalina Dr
- 2517 Argonne Dr
- 3108 Wilbur St
- 2146 Eastside Ct
- 2148 Eastside Ct
- 2804 Jordan St
- 2802 Jordan St
- 2118 Sanders Rd
- 2147 Alfred Ln
- 2810 Anne St
- 2816 King St
- 2004 Denmark Dr
- 2820 Richmond Hill Rd
- 104 Thomas Cir
- 2014 Dunham Ct
- 2018 Dunham Ct
- 2012 Dunham Ct
- 2020 Dunham Ct
- 2015 Brighton Cir
- 2013 Brighton Cir
- 2017 Brighton Cir
- 2010 Dunham Ct
- 2013 Herbert Ln
- 2019 Brighton Cir
- 2022 Dunham Ct
- 2011 Brighton Cir
- 2021 Dunham Ct
- 2015 Dunham Ct
- 2018 Herbert Ln
- 2021 Brighton Cir
- 2024 Dunham Ct
- 2015 Herbert Ln
- 2640 Blueberry Dr
- 2009 Brighton Cir
Your Personal Tour Guide
Ask me questions while you tour the home.