Estimated Value: $394,000 - $741,000
3
Beds
2
Baths
1,699
Sq Ft
$365/Sq Ft
Est. Value
About This Home
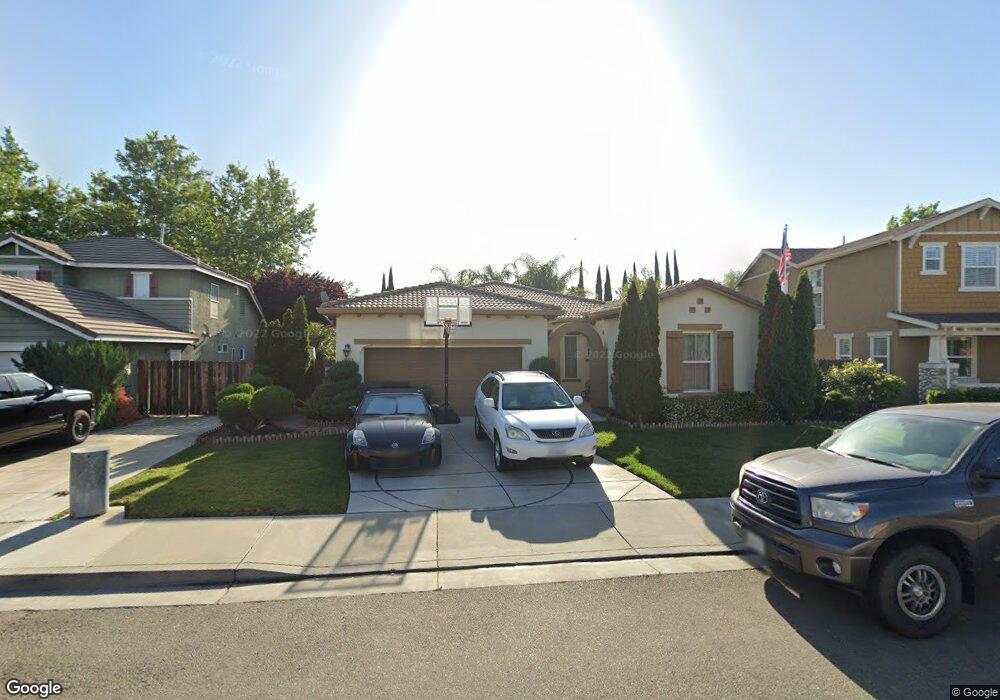
This home is located at 2016 Isabel Virginia Dr, Tracy, CA 95377 and is currently estimated at $619,759, approximately $364 per square foot. 2016 Isabel Virginia Dr is a home located in San Joaquin County with nearby schools including Art Freiler, Merrill F. West High School, and Tracy Independent Study Charter School.
Ownership History
Date
Name
Owned For
Owner Type
Purchase Details
Closed on
Aug 17, 2023
Sold by
Brouillard Marc A and Guinto Yolanda
Bought by
Guinto Brouillard Family Revocable Living Tru and Brouillard
Current Estimated Value
Purchase Details
Closed on
Mar 29, 2013
Sold by
Brouillard Marc A
Bought by
Brouillard Marc A and Guinto Yolanda
Purchase Details
Closed on
Mar 11, 2011
Sold by
Brouillard Yolanda G
Bought by
Brouillard Marc A
Home Financials for this Owner
Home Financials are based on the most recent Mortgage that was taken out on this home.
Original Mortgage
$255,364
Interest Rate
4.77%
Mortgage Type
VA
Purchase Details
Closed on
Mar 2, 2011
Sold by
Bright Development
Bought by
Brouillard Marc A
Home Financials for this Owner
Home Financials are based on the most recent Mortgage that was taken out on this home.
Original Mortgage
$255,364
Interest Rate
4.77%
Mortgage Type
VA
Create a Home Valuation Report for This Property
The Home Valuation Report is an in-depth analysis detailing your home's value as well as a comparison with similar homes in the area
Home Values in the Area
Average Home Value in this Area
Purchase History
| Date | Buyer | Sale Price | Title Company |
|---|---|---|---|
| Guinto Brouillard Family Revocable Living Tru | -- | None Listed On Document | |
| Brouillard Marc A | -- | None Available | |
| Brouillard Marc A | -- | Stewart Title Of California | |
| Brouillard Marc A | $250,000 | Stewart Title Of California |
Source: Public Records
Mortgage History
| Date | Status | Borrower | Loan Amount |
|---|---|---|---|
| Previous Owner | Brouillard Marc A | $255,364 |
Source: Public Records
Tax History Compared to Growth
Tax History
| Year | Tax Paid | Tax Assessment Tax Assessment Total Assessment is a certain percentage of the fair market value that is determined by local assessors to be the total taxable value of land and additions on the property. | Land | Improvement |
|---|---|---|---|---|
| 2025 | $3,781 | $320,281 | $79,427 | $240,854 |
| 2024 | $3,490 | $314,002 | $77,870 | $236,132 |
| 2023 | $3,433 | $307,846 | $76,344 | $231,502 |
| 2022 | $3,360 | $301,811 | $74,848 | $226,963 |
| 2021 | $3,317 | $295,894 | $73,381 | $222,513 |
| 2020 | $3,293 | $292,861 | $72,629 | $220,232 |
| 2019 | $3,238 | $287,119 | $71,205 | $215,914 |
| 2018 | $3,423 | $281,490 | $69,809 | $211,681 |
| 2017 | $3,280 | $275,972 | $68,441 | $207,531 |
| 2016 | $3,366 | $270,563 | $67,100 | $203,463 |
| 2014 | $3,179 | $261,280 | $64,797 | $196,483 |
Source: Public Records
Map
Nearby Homes
- 2001 Bridle Creek Cir
- 2121 Iroula Way
- 1586 Arrigotti Ln
- 2090 Iroula Way
- 2518 Peppercorn Ln
- 1677 Green Springs Ct
- 2610 Meadow Brook Ln
- 1827 Paradise Valley Ct
- 1762 Ashtree Ct
- 2821 Oxford Ln
- 1533 Vinewood Way
- 2688 W Byron Rd
- 1403 Promenade Cir
- 1150 Palomar Ct
- 1740 Hampshire Ln
- 2963 Rugby Ct
- 1422 Greenwillow Way
- 1735 W Kavanagh Ave
- 1830 Laurelgrove Ln
- 1865 Newport Ct
- 1996 Isabel Virginia Dr
- 2046 Isabel Virginia Dr
- 1986 Isabel Virginia Dr
- 2066 Isabel Virginia Dr
- 2007 Isabel Virginia Dr
- 2037 Isabel Virginia Dr
- 1976 Isabel Virginia Dr
- 2317 La Mesa Dr
- 2106 Isabel Virginia Dr
- 2057 Isabel Virginia Dr
- 1981 Valley View Dr
- 1956 Isabel Virginia Dr
- 2327 La Mesa Dr
- 2087 Isabel Virginia Dr
- 2136 Isabel Virginia Dr
- 2338 Riviera Ct
- 2115 Alfred George Ct
- 2275 Foothill Ranch Dr
- 1941 Valley View Dr
- 2107 Isabel Virginia Dr