Estimated Value: $353,121 - $401,000
3
Beds
2
Baths
1,690
Sq Ft
$227/Sq Ft
Est. Value
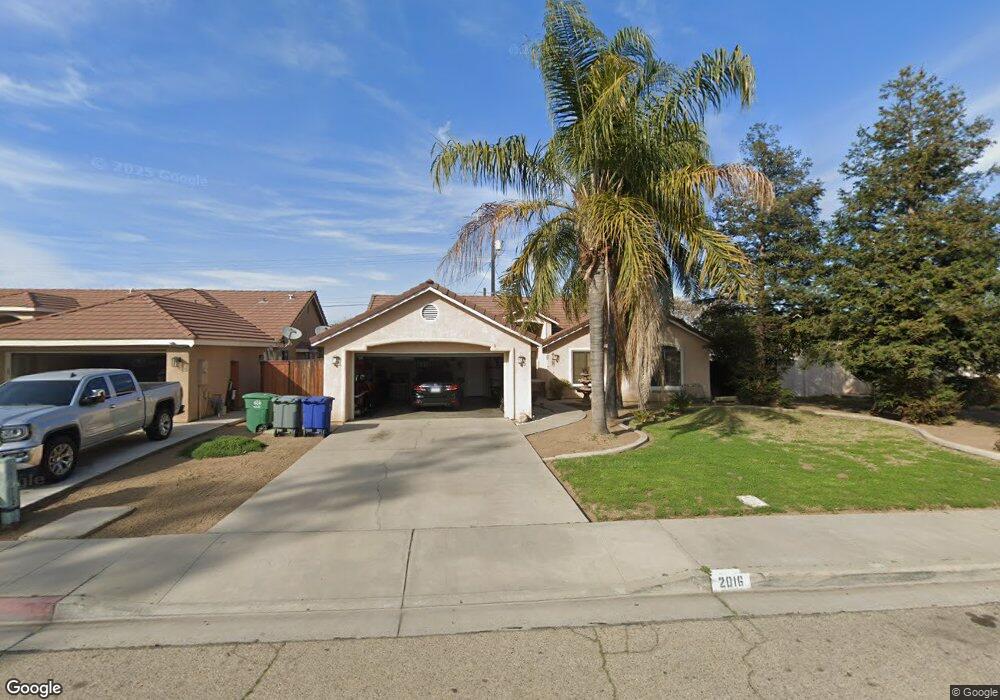
About This Home
This home is located at 2016 Oak St, Selma, CA 93662 and is currently estimated at $383,780, approximately $227 per square foot. 2016 Oak St is a home located in Fresno County with nearby schools including Theodore Roosevelt Elementary School, Abraham Lincoln Middle School, and Selma High School.
Ownership History
Date
Name
Owned For
Owner Type
Purchase Details
Closed on
Oct 6, 2011
Sold by
Cvi Group Llc
Bought by
Flores Jesse
Current Estimated Value
Home Financials for this Owner
Home Financials are based on the most recent Mortgage that was taken out on this home.
Original Mortgage
$143,760
Interest Rate
4.25%
Mortgage Type
FHA
Purchase Details
Closed on
Jul 19, 2011
Sold by
Garcia Raul and Garcia Carmen
Bought by
Cvi Group Llc
Purchase Details
Closed on
Apr 16, 2009
Sold by
Garcia Carmen
Bought by
Garcia Raul
Purchase Details
Closed on
Feb 26, 1996
Sold by
Moonier James E and Moonier Carol D
Bought by
Garcia Raul and Garcia Carmen
Home Financials for this Owner
Home Financials are based on the most recent Mortgage that was taken out on this home.
Original Mortgage
$98,800
Interest Rate
7.46%
Create a Home Valuation Report for This Property
The Home Valuation Report is an in-depth analysis detailing your home's value as well as a comparison with similar homes in the area
Home Values in the Area
Average Home Value in this Area
Purchase History
| Date | Buyer | Sale Price | Title Company |
|---|---|---|---|
| Flores Jesse | $147,500 | Placer Title Company | |
| Cvi Group Llc | $110,000 | None Available | |
| Garcia Raul | -- | None Available | |
| Garcia Raul | $104,000 | Chicago Title Co |
Source: Public Records
Mortgage History
| Date | Status | Borrower | Loan Amount |
|---|---|---|---|
| Previous Owner | Flores Jesse | $143,760 | |
| Previous Owner | Garcia Raul | $98,800 |
Source: Public Records
Tax History Compared to Growth
Tax History
| Year | Tax Paid | Tax Assessment Tax Assessment Total Assessment is a certain percentage of the fair market value that is determined by local assessors to be the total taxable value of land and additions on the property. | Land | Improvement |
|---|---|---|---|---|
| 2025 | $3,242 | $185,256 | $43,956 | $141,300 |
| 2023 | $2,784 | $178,064 | $42,250 | $135,814 |
| 2022 | $3,067 | $174,573 | $41,422 | $133,151 |
| 2021 | $2,996 | $171,151 | $40,610 | $130,541 |
| 2020 | $2,966 | $169,397 | $40,194 | $129,203 |
| 2019 | $2,890 | $166,076 | $39,406 | $126,670 |
| 2018 | $2,825 | $162,821 | $38,634 | $124,187 |
| 2017 | $2,736 | $159,629 | $37,877 | $121,752 |
| 2016 | $2,474 | $156,500 | $37,135 | $119,365 |
| 2015 | $2,510 | $154,151 | $36,578 | $117,573 |
| 2014 | $2,447 | $151,132 | $35,862 | $115,270 |
Source: Public Records
Map
Nearby Homes