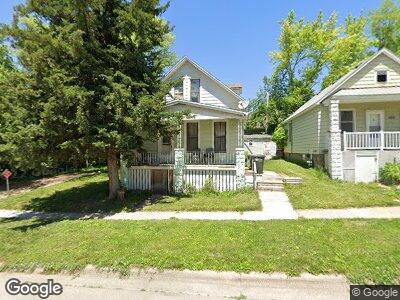
2016 P St Omaha, NE 68107
Brown Park NeighborhoodEstimated Value: $108,000 - $150,000
2
Beds
4
Baths
924
Sq Ft
$142/Sq Ft
Est. Value
About This Home
This home is located at 2016 P St, Omaha, NE 68107 and is currently estimated at $131,352, approximately $142 per square foot. 2016 P St is a home located in Douglas County with nearby schools including Gomez Heritage Elementary School, R.M. Marrs Magnet Middle School, and South High School.
Ownership History
Date
Name
Owned For
Owner Type
Purchase Details
Closed on
Aug 30, 2019
Sold by
Garcia Jose C
Bought by
Villafuerte Teresa Ann
Current Estimated Value
Purchase Details
Closed on
Jun 4, 2002
Sold by
Updegraff Dorothy V
Bought by
Garcia Jose C
Home Financials for this Owner
Home Financials are based on the most recent Mortgage that was taken out on this home.
Original Mortgage
$55,000
Interest Rate
6.89%
Create a Home Valuation Report for This Property
The Home Valuation Report is an in-depth analysis detailing your home's value as well as a comparison with similar homes in the area
Home Values in the Area
Average Home Value in this Area
Purchase History
| Date | Buyer | Sale Price | Title Company |
|---|---|---|---|
| Villafuerte Teresa Ann | -- | None Available | |
| Garcia Jose C | -- | None Available | |
| Garcia Jose C | $65,000 | -- |
Source: Public Records
Mortgage History
| Date | Status | Borrower | Loan Amount |
|---|---|---|---|
| Previous Owner | Garcia Jose C | $54,730 | |
| Previous Owner | Garcia Jose C | $55,000 |
Source: Public Records
Tax History Compared to Growth
Tax History
| Year | Tax Paid | Tax Assessment Tax Assessment Total Assessment is a certain percentage of the fair market value that is determined by local assessors to be the total taxable value of land and additions on the property. | Land | Improvement |
|---|---|---|---|---|
| 2023 | $1,456 | $69,000 | $8,200 | $60,800 |
| 2022 | $1,420 | $66,500 | $5,700 | $60,800 |
| 2021 | $1,408 | $66,500 | $5,700 | $60,800 |
| 2020 | $1,306 | $61,000 | $5,700 | $55,300 |
| 2019 | $1,106 | $51,500 | $5,700 | $45,800 |
| 2018 | $869 | $40,400 | $5,700 | $34,700 |
| 2017 | $798 | $40,200 | $5,500 | $34,700 |
| 2016 | $798 | $37,200 | $2,500 | $34,700 |
| 2015 | $788 | $37,200 | $2,500 | $34,700 |
| 2014 | $788 | $37,200 | $2,500 | $34,700 |
Source: Public Records
Map
Nearby Homes