Estimated Value: $213,000 - $293,000
2
Beds
1
Bath
1,182
Sq Ft
$220/Sq Ft
Est. Value
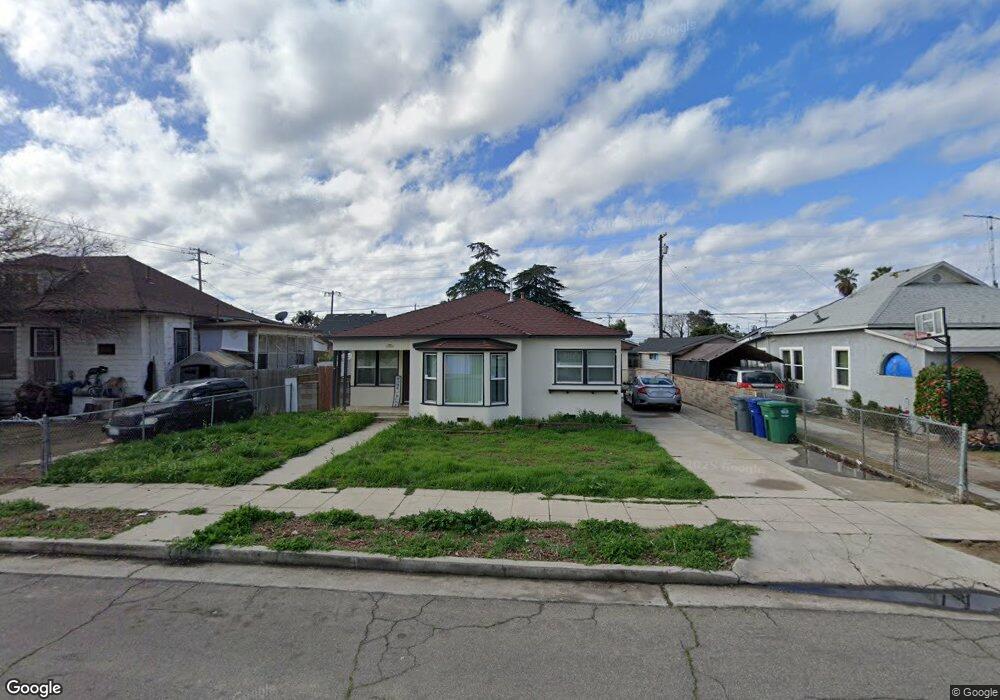
About This Home
This home is located at 2017 Sylvia St, Selma, CA 93662 and is currently estimated at $260,242, approximately $220 per square foot. 2017 Sylvia St is a home located in Fresno County with nearby schools including James Garfield Elementary School, Abraham Lincoln Middle School, and Selma High School.
Ownership History
Date
Name
Owned For
Owner Type
Purchase Details
Closed on
Feb 24, 2005
Sold by
Wilkinson Tina Cardinali
Bought by
Henslee Ron
Current Estimated Value
Purchase Details
Closed on
Jul 17, 2004
Sold by
Wilkenson Johhny V
Bought by
Henslee Ron
Purchase Details
Closed on
Aug 26, 1993
Sold by
Whisenhunt Paul Edward and Whisenhunt Doyle Edward
Bought by
Wilkinson Johnnie and Wilkinson Tina L
Home Financials for this Owner
Home Financials are based on the most recent Mortgage that was taken out on this home.
Original Mortgage
$71,400
Interest Rate
6.85%
Mortgage Type
Assumption
Create a Home Valuation Report for This Property
The Home Valuation Report is an in-depth analysis detailing your home's value as well as a comparison with similar homes in the area
Home Values in the Area
Average Home Value in this Area
Purchase History
| Date | Buyer | Sale Price | Title Company |
|---|---|---|---|
| Henslee Ron | -- | -- | |
| Henslee Ron | $90,000 | -- | |
| Wilkinson Johnnie | $70,000 | Chicago Title Company |
Source: Public Records
Mortgage History
| Date | Status | Borrower | Loan Amount |
|---|---|---|---|
| Previous Owner | Wilkinson Johnnie | $71,400 |
Source: Public Records
Tax History
| Year | Tax Paid | Tax Assessment Tax Assessment Total Assessment is a certain percentage of the fair market value that is determined by local assessors to be the total taxable value of land and additions on the property. | Land | Improvement |
|---|---|---|---|---|
| 2025 | $3,072 | $174,218 | $44,595 | $129,623 |
| 2023 | $2,537 | $167,455 | $42,864 | $124,591 |
| 2022 | $2,827 | $164,173 | $42,024 | $122,149 |
| 2021 | $2,592 | $146,400 | $30,300 | $116,100 |
| 2020 | $2,563 | $145,000 | $30,000 | $115,000 |
| 2019 | $2,237 | $120,000 | $30,000 | $90,000 |
| 2018 | $2,003 | $102,000 | $30,600 | $71,400 |
| 2017 | $1,925 | $100,000 | $30,000 | $70,000 |
| 2016 | $1,609 | $85,000 | $30,000 | $55,000 |
| 2015 | $2,029 | $120,000 | $30,000 | $90,000 |
| 2014 | $1,677 | $91,100 | $23,200 | $67,900 |
Source: Public Records
Map
Nearby Homes
- 2116 Sylvia St
- 2772 Valley View St
- 2022 Bauder St
- 2226 Arrants St
- 0 Rose Ave
- 2629 Mccall Ave
- 2510 Whitson St
- 2561 Stillman St Unit 111
- 2753 Thompson Ave
- 2766 Lee St
- 2002 Merced St
- 12623 S Mccall Ave
- 2221 Floral Ave
- 1517 Stillman St
- 1361 Almond St
- 2469 Shaft St
- 2482 Country Club Ln
- 2405 Country Club Ln
- 1233 Redwood Ln
- 1167 Mill St
Your Personal Tour Guide
Ask me questions while you tour the home.