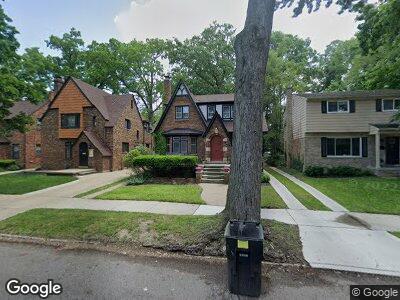
20176 Briarcliff Rd Unit Bldg-Unit Detroit, MI 48221
Green Acres NeighborhoodEstimated Value: $289,000 - $381,000
--
Bed
3
Baths
2,142
Sq Ft
$157/Sq Ft
Est. Value
About This Home
This home is located at 20176 Briarcliff Rd Unit Bldg-Unit, Detroit, MI 48221 and is currently estimated at $336,261, approximately $156 per square foot. 20176 Briarcliff Rd Unit Bldg-Unit is a home located in Wayne County with nearby schools including Pasteur Elementary School, Charles L. Spain Elementary-Middle School, and Edward 'Duke' Ellington Conservatory of Music and Art.
Ownership History
Date
Name
Owned For
Owner Type
Purchase Details
Closed on
Jan 27, 2023
Sold by
Waraksa Neil D and Waraksa Jennifer
Bought by
Neil D Waraksa And Jennifer R Jaramillo Trust
Current Estimated Value
Purchase Details
Closed on
May 31, 2018
Sold by
Smiddy Katherine and Smiddy Stephen Michael
Bought by
Waraksa Neil
Home Financials for this Owner
Home Financials are based on the most recent Mortgage that was taken out on this home.
Original Mortgage
$200,000
Interest Rate
4.5%
Mortgage Type
New Conventional
Purchase Details
Closed on
Nov 30, 2015
Sold by
Kyriacopoulos John and Kyriacopoulos Jane
Bought by
Smiddy Katherine
Home Financials for this Owner
Home Financials are based on the most recent Mortgage that was taken out on this home.
Original Mortgage
$69,600
Interest Rate
3.75%
Mortgage Type
New Conventional
Create a Home Valuation Report for This Property
The Home Valuation Report is an in-depth analysis detailing your home's value as well as a comparison with similar homes in the area
Home Values in the Area
Average Home Value in this Area
Purchase History
| Date | Buyer | Sale Price | Title Company |
|---|---|---|---|
| Neil D Waraksa And Jennifer R Jaramillo Trust | -- | -- | |
| Waraksa Neil | $253,000 | Multiple | |
| Smiddy Katherine | $95,000 | First American Title Ins Co |
Source: Public Records
Mortgage History
| Date | Status | Borrower | Loan Amount |
|---|---|---|---|
| Previous Owner | Waraksa Neil | $200,000 | |
| Previous Owner | Smiddy Katherine | $69,600 |
Source: Public Records
Tax History Compared to Growth
Tax History
| Year | Tax Paid | Tax Assessment Tax Assessment Total Assessment is a certain percentage of the fair market value that is determined by local assessors to be the total taxable value of land and additions on the property. | Land | Improvement |
|---|---|---|---|---|
| 2024 | $3,689 | $144,800 | $0 | $0 |
| 2023 | $3,583 | $115,900 | $0 | $0 |
| 2022 | $3,979 | $96,000 | $0 | $0 |
| 2021 | $3,863 | $78,100 | $0 | $0 |
| 2020 | $3,815 | $64,600 | $0 | $0 |
| 2019 | $3,749 | $49,900 | $0 | $0 |
| 2018 | $2,391 | $40,900 | $0 | $0 |
| 2017 | $680 | $37,600 | $0 | $0 |
| 2016 | $3,398 | $41,100 | $0 | $0 |
| 2015 | $3,740 | $37,400 | $0 | $0 |
| 2013 | $3,939 | $39,393 | $0 | $0 |
| 2010 | -- | $54,677 | $1,649 | $53,028 |
Source: Public Records
Map
Nearby Homes
- 20121 Briarcliff Rd
- 20201 Renfrew Rd
- 19938 Renfrew Rd
- 20073 Shrewsbury Rd
- 20179 Canterbury Rd
- 19650 Stratford Rd
- 2564 Woodstock Dr
- 457 W Bennett
- 20470 Warrington Dr
- 20403 Warrington Dr
- 19510 Stratford Rd
- 325 W Chesterfield St
- 415 Laprairie St
- 19566 Canterbury Rd
- 381 Heatherdale Ln
- 19445 Shrewsbury Rd
- 287 Fielding St
- 19994 Santa Rosa Dr
- 20117 Santa Rosa Dr
- 539 Edgewood Place
- 20176 Briarcliff Rd Unit Bldg-Unit
- 20176 Briarcliff Rd
- 20184 Briarcliff Rd
- 20170 Briarcliff Rd
- 20171 Lichfield Rd
- 20194 Briarcliff Rd
- 20154 Briarcliff Rd
- 20195 Lichfield Rd
- 20161 Lichfield Rd
- 20200 Briarcliff Rd
- 20203 Lichfield Rd
- 20150 Briarcliff Rd
- 20185 Lichfield Rd
- 20185 Lichfield Rd
- 20210 Briarcliff Rd
- 20142 Briarcliff Rd
- 20155 Lichfield Rd
- 20155 Lichfield Rd
- 20145 Lichfield Rd
- 20177 Briarcliff Rd