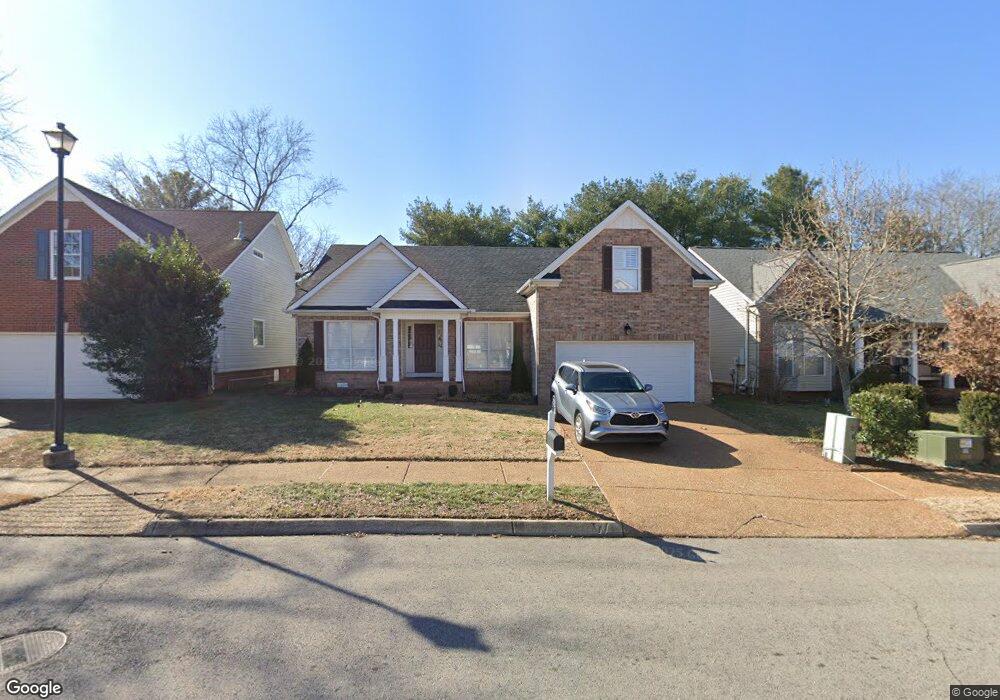
2018 Belmont Cir Franklin, TN 37069
Berrys Chapel NeighborhoodEstimated Value: $568,970 - $657,000
--
Bed
2
Baths
1,864
Sq Ft
$338/Sq Ft
Est. Value
About This Home
This home is located at 2018 Belmont Cir, Franklin, TN 37069 and is currently estimated at $629,493, approximately $337 per square foot. 2018 Belmont Cir is a home located in Williamson County with nearby schools including Hunters Bend Elementary School, Grassland Middle School, and Franklin High School.
Ownership History
Date
Name
Owned For
Owner Type
Purchase Details
Closed on
Aug 17, 2017
Sold by
Baird David W and Baird Jeanne
Bought by
Baird David W and Baird Jeanne
Current Estimated Value
Home Financials for this Owner
Home Financials are based on the most recent Mortgage that was taken out on this home.
Original Mortgage
$165,950
Outstanding Balance
$88,968
Interest Rate
4.03%
Mortgage Type
New Conventional
Estimated Equity
$540,525
Purchase Details
Closed on
Sep 3, 2004
Sold by
Napolitano Susan Anderson
Bought by
Baird David W
Home Financials for this Owner
Home Financials are based on the most recent Mortgage that was taken out on this home.
Original Mortgage
$219,000
Interest Rate
8.75%
Mortgage Type
Stand Alone First
Purchase Details
Closed on
Aug 23, 1995
Sold by
Centex Real Estate Corp
Bought by
Ah Anderson Wilm
Purchase Details
Closed on
Jul 24, 1995
Bought by
Centex Real Estate Corp
Create a Home Valuation Report for This Property
The Home Valuation Report is an in-depth analysis detailing your home's value as well as a comparison with similar homes in the area
Home Values in the Area
Average Home Value in this Area
Purchase History
| Date | Buyer | Sale Price | Title Company |
|---|---|---|---|
| Baird David W | -- | None Available | |
| Baird David W | $219,900 | Cumberland Title Company | |
| Ah Anderson Wilm | $149,736 | -- | |
| Centex Real Estate Corp | $81,120 | -- |
Source: Public Records
Mortgage History
| Date | Status | Borrower | Loan Amount |
|---|---|---|---|
| Open | Baird David W | $165,950 | |
| Closed | Baird David W | $219,000 |
Source: Public Records
Tax History Compared to Growth
Tax History
| Year | Tax Paid | Tax Assessment Tax Assessment Total Assessment is a certain percentage of the fair market value that is determined by local assessors to be the total taxable value of land and additions on the property. | Land | Improvement |
|---|---|---|---|---|
| 2024 | $2,151 | $99,775 | $30,000 | $69,775 |
| 2023 | $2,151 | $99,775 | $30,000 | $69,775 |
| 2022 | $2,151 | $99,775 | $30,000 | $69,775 |
| 2021 | $2,151 | $99,775 | $30,000 | $69,775 |
| 2020 | $1,982 | $76,875 | $18,750 | $58,125 |
| 2019 | $1,982 | $76,875 | $18,750 | $58,125 |
| 2018 | $1,928 | $76,875 | $18,750 | $58,125 |
| 2017 | $1,912 | $76,875 | $18,750 | $58,125 |
| 2016 | $0 | $76,875 | $18,750 | $58,125 |
| 2015 | -- | $62,075 | $16,250 | $45,825 |
| 2014 | -- | $62,075 | $16,250 | $45,825 |
Source: Public Records
Map
Nearby Homes
- 913 Idlewild Ct
- 826 Brandyleigh Ct
- 2012 Lundy Pass
- 810 Brandyleigh Ct
- 148 Cavalcade Cir
- 140 Cavalcade Cir
- 196 Clarendon Cir
- 114 Stanton Hall Ln Unit 114
- 426 Cotton Ln
- 96 Somerton Park Unit 96
- 303 Montrose Ct
- 306 Montrose Ct
- 517 Meadowgreen Dr
- 604 Meadowgreen Dr
- 18 Holland Park Ln Unit 18
- 24 Holland Park Ln Unit 24
- 803 Shady Glen Ct
- 101 Alton Park Ln Unit 101
- 33 Holland Park Ln
- 200 Heathstone Cir
- 2016 Belmont Cir
- 2022 Belmont Cir
- 2014 Belmont Cir
- 3001 Helmsdale Ln
- 2024 Belmont Cir
- 3000 Helmsdale Ln
- 2012 Belmont Cir
- 2025 Belmont Cir
- 3005 Helmsdale Ln
- 2026 Belmont Cir
- 3004 Helmsdale Ln
- 1030 Glastonbury Dr
- 1028 Glastonbury Dr
- 2010 Belmont Cir
- 2009 Belmont Cir
- 1032 Glastonbury Dr
- 1026 Glastonbury Dr
- 2031 Belmont Cir
- 1034 Glastonbury Dr
- 1024 Glastonbury Dr