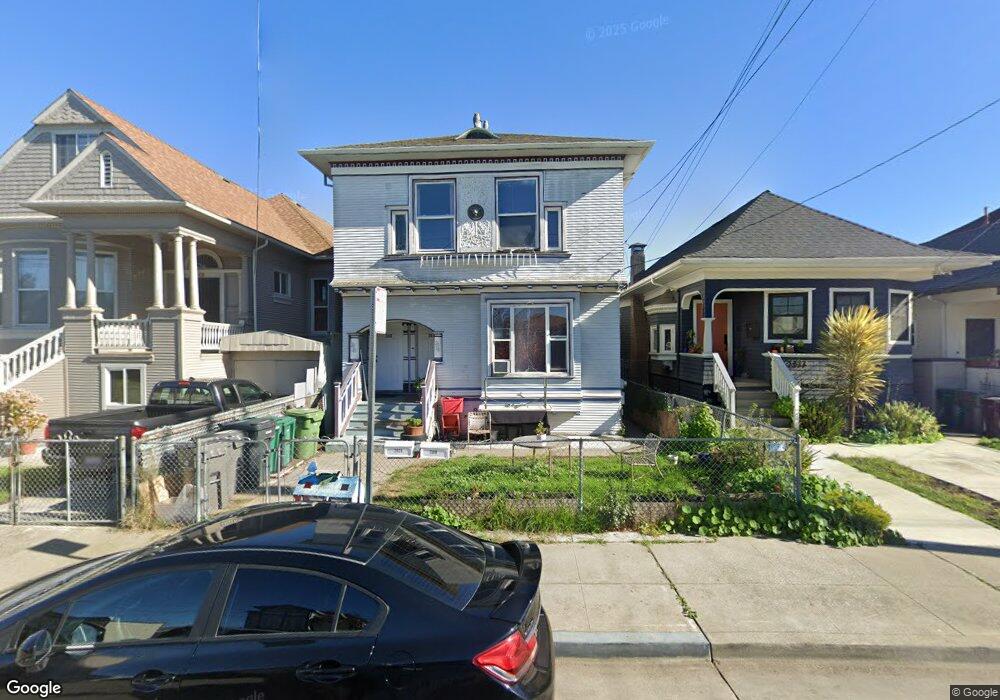
2018 Filbert St Unit 2 Oakland, CA 94607
West Oakland NeighborhoodEstimated Value: $501,000 - $754,000
6
Beds
2
Baths
1,936
Sq Ft
$349/Sq Ft
Est. Value
About This Home
This home is located at 2018 Filbert St Unit 2, Oakland, CA 94607 and is currently estimated at $676,295, approximately $349 per square foot. 2018 Filbert St Unit 2 is a home located in Alameda County with nearby schools including M. L. King Jr. Elementary School, West Oakland Middle School, and McClymonds High School.
Ownership History
Date
Name
Owned For
Owner Type
Purchase Details
Closed on
Oct 6, 2018
Sold by
Tan Rilin and Lei Pei Ying
Bought by
Tan Rilin and Lei Pei Ying
Current Estimated Value
Purchase Details
Closed on
Oct 1, 2008
Sold by
Deutsche Bank Trust Company Americas
Bought by
Tan Rilin and Lei Pei Ying
Home Financials for this Owner
Home Financials are based on the most recent Mortgage that was taken out on this home.
Original Mortgage
$132,300
Outstanding Balance
$86,442
Interest Rate
6.07%
Mortgage Type
Purchase Money Mortgage
Estimated Equity
$589,853
Purchase Details
Closed on
Jun 27, 2008
Sold by
Vasconcelos Francisco
Bought by
Deutsche Bank Trust Co Americas and Hsbc Bank Usa Na Ace 2006-Nc1
Purchase Details
Closed on
Sep 28, 2005
Sold by
Wynne Ioma S
Bought by
Vasconcelos Francisco
Home Financials for this Owner
Home Financials are based on the most recent Mortgage that was taken out on this home.
Original Mortgage
$436,800
Interest Rate
7.19%
Mortgage Type
Purchase Money Mortgage
Create a Home Valuation Report for This Property
The Home Valuation Report is an in-depth analysis detailing your home's value as well as a comparison with similar homes in the area
Home Values in the Area
Average Home Value in this Area
Purchase History
| Date | Buyer | Sale Price | Title Company |
|---|---|---|---|
| Tan Rilin | -- | None Available | |
| Tan Rilin | $189,000 | First American Title Company | |
| Deutsche Bank Trust Co Americas | $195,500 | None Available | |
| Vasconcelos Francisco | $546,000 | Fidelity National Title Co |
Source: Public Records
Mortgage History
| Date | Status | Borrower | Loan Amount |
|---|---|---|---|
| Open | Tan Rilin | $132,300 | |
| Previous Owner | Vasconcelos Francisco | $436,800 |
Source: Public Records
Tax History
| Year | Tax Paid | Tax Assessment Tax Assessment Total Assessment is a certain percentage of the fair market value that is determined by local assessors to be the total taxable value of land and additions on the property. | Land | Improvement |
|---|---|---|---|---|
| 2025 | $5,362 | $243,368 | $73,010 | $170,358 |
| 2024 | $5,362 | $238,598 | $71,579 | $167,019 |
| 2023 | $5,496 | $233,921 | $70,176 | $163,745 |
| 2022 | $5,225 | $229,335 | $68,800 | $160,535 |
| 2021 | $4,813 | $224,840 | $67,452 | $157,388 |
| 2020 | $4,757 | $222,535 | $66,760 | $155,775 |
| 2019 | $4,462 | $218,173 | $65,452 | $152,721 |
| 2018 | $4,372 | $213,896 | $64,169 | $149,727 |
| 2017 | $4,158 | $209,702 | $62,910 | $146,792 |
| 2016 | $3,959 | $205,591 | $61,677 | $143,914 |
| 2015 | $3,935 | $202,505 | $60,751 | $141,754 |
| 2014 | $3,986 | $198,540 | $59,562 | $138,978 |
Source: Public Records
Map
Nearby Homes
- 2018 Filbert St
- 2014 Filbert St
- 2024 Filbert St
- 2010 Filbert St
- 2028 Filbert St
- 2006 Filbert St
- 2032 Filbert St
- 2000 Filbert St
- 2011 Myrtle St Unit ABCD
- 2011 Myrtle St Unit ABCD
- 2011 Myrtle St Unit ABCD
- 2011 Myrtle St Unit ABCD
- 2007 Myrtle St
- 2015 Myrtle St
- 967 21st St
- 2003 Myrtle St
- 963 21st St
- 2005 Filbert St
- 971 21st St
- 2021 Myrtle St
Your Personal Tour Guide
Ask me questions while you tour the home.