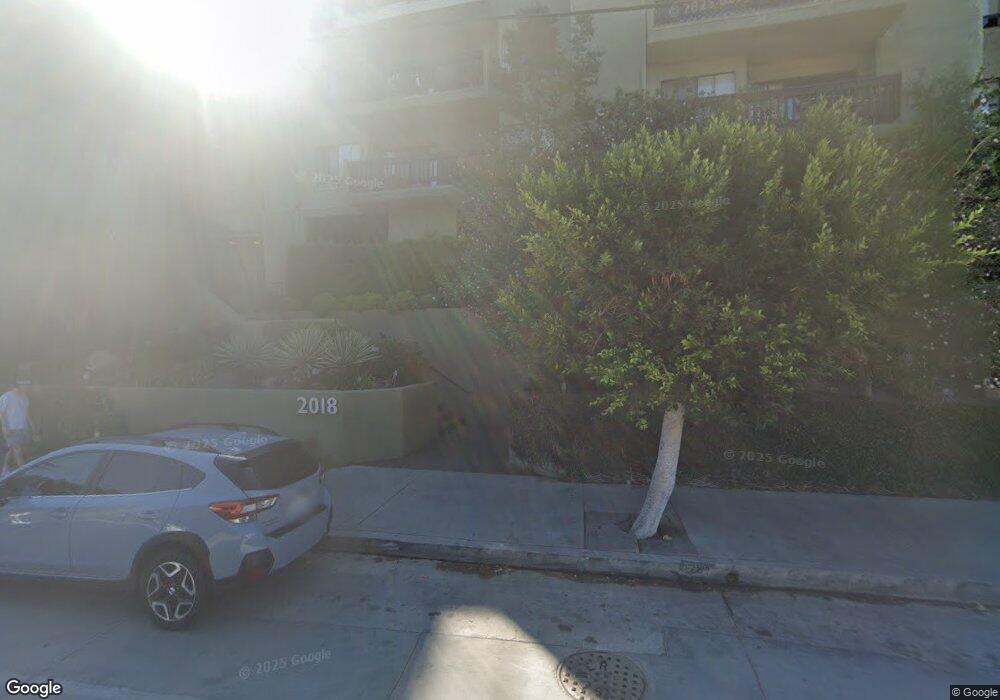
2018 Griffith Pak Blvd Unit 220 Los Angeles, CA 90039
Estimated Value: $789,624 - $1,069,000
2
Beds
2
Baths
1,070
Sq Ft
$836/Sq Ft
Est. Value
About This Home
This home is located at 2018 Griffith Pak Blvd Unit 220, Los Angeles, CA 90039 and is currently estimated at $894,656, approximately $836 per square foot. 2018 Griffith Pak Blvd Unit 220 is a home located in Los Angeles County with nearby schools including Ivanhoe Elementary, Thomas Starr King Middle School Film and Media Magnet, and John Marshall Senior High.
Ownership History
Date
Name
Owned For
Owner Type
Purchase Details
Closed on
Aug 19, 2013
Sold by
Gagnon Dorothy
Bought by
Scott Rebecca and Scott Gavin
Current Estimated Value
Purchase Details
Closed on
Sep 8, 2012
Sold by
Hollahan Mark
Bought by
Hollahan Mark A and The Mark A Hollahan 2012 Revocable Trust
Purchase Details
Closed on
Oct 16, 2003
Sold by
Ramirez Armando
Bought by
Hollahan Mark
Home Financials for this Owner
Home Financials are based on the most recent Mortgage that was taken out on this home.
Original Mortgage
$80,100
Interest Rate
5.72%
Mortgage Type
Purchase Money Mortgage
Purchase Details
Closed on
Jun 18, 1998
Sold by
Martel Patricia E
Bought by
Ramirez Armando and Mitchell Justin W
Home Financials for this Owner
Home Financials are based on the most recent Mortgage that was taken out on this home.
Original Mortgage
$143,100
Interest Rate
7.06%
Create a Home Valuation Report for This Property
The Home Valuation Report is an in-depth analysis detailing your home's value as well as a comparison with similar homes in the area
Home Values in the Area
Average Home Value in this Area
Purchase History
| Date | Buyer | Sale Price | Title Company |
|---|---|---|---|
| Scott Rebecca | $417,504 | Fidelity Van Nuys | |
| Hollahan Mark A | -- | None Available | |
| Hollahan Mark | $317,500 | Equity Title Company | |
| Ramirez Armando | $159,000 | -- |
Source: Public Records
Mortgage History
| Date | Status | Borrower | Loan Amount |
|---|---|---|---|
| Previous Owner | Hollahan Mark | $80,100 | |
| Previous Owner | Ramirez Armando | $143,100 |
Source: Public Records
Tax History Compared to Growth
Tax History
| Year | Tax Paid | Tax Assessment Tax Assessment Total Assessment is a certain percentage of the fair market value that is determined by local assessors to be the total taxable value of land and additions on the property. | Land | Improvement |
|---|---|---|---|---|
| 2025 | $6,172 | $511,786 | $272,012 | $239,774 |
| 2024 | $6,172 | $501,752 | $266,679 | $235,073 |
| 2023 | $6,052 | $491,914 | $261,450 | $230,464 |
| 2022 | $5,768 | $482,270 | $256,324 | $225,946 |
| 2021 | $5,695 | $472,815 | $251,299 | $221,516 |
| 2019 | $5,524 | $458,794 | $243,847 | $214,947 |
| 2018 | $5,504 | $449,799 | $239,066 | $210,733 |
| 2016 | $5,257 | $432,334 | $229,784 | $202,550 |
| 2015 | $5,180 | $425,841 | $226,333 | $199,508 |
| 2014 | $5,201 | $417,500 | $221,900 | $195,600 |
Source: Public Records
Map
Nearby Homes
- 2018 Griffith Park Blvd Unit 109
- 2015 Hyperion Ave
- 1921 Lucile Ave
- 2039 Micheltorena St
- 1962 Micheltorena St
- 3850 Udell Ct
- 2162 Lyric Ave
- 2067 Mayview Dr
- 3826 Sunset Dr
- 3822 Clayton Ave
- 3831 Fernwood Ave
- 3839 Fountain Ave
- 2133 Mayview Dr
- 3209 Windsor Ave
- 3950 De Longpre Ave
- 3214 Windsor Ave
- 3928 Clayton Ave
- 2266 Ronda Vista Dr
- 1757 Hollyvista Ave
- 2264 Moreno Dr
- 2018 Griffith Park Blvd Unit 123
- 2018 Griffith Park Blvd Unit 305
- 2018 Griffith Park Blvd Unit 102
- 2018 Griffith Park Blvd Unit 108
- 2018 Griffith Park Blvd Unit 307
- 2018 Griffith Park Blvd Unit 218
- 2018 Griffith Park Blvd Unit 223
- 2018 Griffith Park Blvd Unit 317
- 2018 Griffith Park Blvd Unit 220
- 2018 Griffith Park Blvd Unit 106
- 2018 Griffith Park Blvd Unit 126
- 2018 Griffith Park Blvd Unit 222
- 2018 Griffith Park Blvd Unit 318
- 2018 Griffith Park Blvd Unit 312
- 2018 Griffith Park Blvd Unit 303
- 2018 Griffith Park Blvd Unit 216
- 2018 Griffith Park Blvd Unit 212
- 2018 Griffith Park Blvd Unit 207
- 2018 Griffith Park Blvd Unit 203
- 2018 Griffith Park Blvd Unit 315