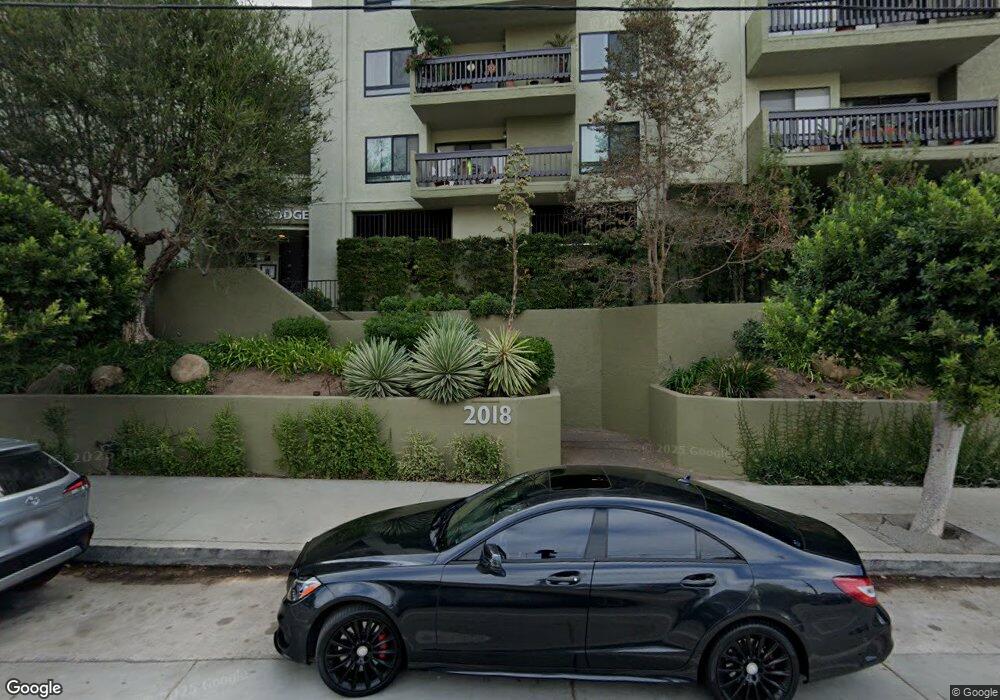
2018 Griffith pk Blvd Unit 122 Los Angeles, CA 90039
Silver Lake NeighborhoodEstimated Value: $766,000 - $1,024,000
2
Beds
2
Baths
1,209
Sq Ft
$721/Sq Ft
Est. Value
About This Home
This home is located at 2018 Griffith pk Blvd Unit 122, Los Angeles, CA 90039 and is currently estimated at $871,238, approximately $720 per square foot. 2018 Griffith pk Blvd Unit 122 is a home located in Los Angeles County with nearby schools including Ivanhoe Elementary, Thomas Starr King Middle School Film and Media Magnet, and John Marshall Senior High.
Ownership History
Date
Name
Owned For
Owner Type
Purchase Details
Closed on
Jan 6, 2017
Sold by
Rosen Stuart M
Bought by
Hatem Martina Bick and Hatem Richard Charles
Current Estimated Value
Home Financials for this Owner
Home Financials are based on the most recent Mortgage that was taken out on this home.
Original Mortgage
$527,250
Outstanding Balance
$434,626
Interest Rate
4.13%
Mortgage Type
New Conventional
Estimated Equity
$436,612
Purchase Details
Closed on
Jan 30, 2002
Sold by
Davern Heather Mackenzie
Bought by
Rosen Stuart M
Home Financials for this Owner
Home Financials are based on the most recent Mortgage that was taken out on this home.
Original Mortgage
$143,000
Interest Rate
6.8%
Purchase Details
Closed on
Jan 20, 1998
Sold by
Mackenzie Heather
Bought by
Davern Heather Mackenzie and Davern Donald John
Create a Home Valuation Report for This Property
The Home Valuation Report is an in-depth analysis detailing your home's value as well as a comparison with similar homes in the area
Home Values in the Area
Average Home Value in this Area
Purchase History
| Date | Buyer | Sale Price | Title Company |
|---|---|---|---|
| Hatem Martina Bick | $555,000 | California Title Company | |
| Rosen Stuart M | $220,000 | Gateway Title Company | |
| Davern Heather Mackenzie | -- | -- |
Source: Public Records
Mortgage History
| Date | Status | Borrower | Loan Amount |
|---|---|---|---|
| Open | Hatem Martina Bick | $527,250 | |
| Previous Owner | Rosen Stuart M | $143,000 |
Source: Public Records
Tax History Compared to Growth
Tax History
| Year | Tax Paid | Tax Assessment Tax Assessment Total Assessment is a certain percentage of the fair market value that is determined by local assessors to be the total taxable value of land and additions on the property. | Land | Improvement |
|---|---|---|---|---|
| 2025 | $7,738 | $644,121 | $370,804 | $273,317 |
| 2024 | $7,738 | $631,492 | $363,534 | $267,958 |
| 2023 | $7,587 | $619,110 | $356,406 | $262,704 |
| 2022 | $7,231 | $606,971 | $349,418 | $257,553 |
| 2021 | $7,140 | $595,070 | $342,567 | $252,503 |
| 2019 | $6,925 | $577,421 | $332,407 | $245,014 |
| 2018 | $6,903 | $566,100 | $325,890 | $240,210 |
| 2016 | $3,382 | $274,534 | $97,084 | $177,450 |
| 2015 | $3,333 | $270,411 | $95,626 | $174,785 |
| 2014 | $3,350 | $265,115 | $93,753 | $171,362 |
Source: Public Records
Map
Nearby Homes
- 2018 Griffith Park Blvd Unit 109
- 3850 Udell Ct
- 2067 Mayview Dr
- 3901 De Longpre Ave
- 3839 Fountain Ave
- 2133 Mayview Dr
- 3209 Windsor Ave
- 3950 De Longpre Ave
- 3928 Clayton Ave
- 1757 Hollyvista Ave
- 2422 Claremont Ave
- 1651 Golden Gate Ave
- 1814 Webster Ave
- 1644 Maltman Ave
- 1923 Hollyvista Ave
- 2372 Kenilworth Ave
- 1132 Manzanita St
- 1118 Sanborn Ave
- 1734 Redesdale Ave
- 3924 W Sunset Blvd
- 2018 Griffith pk Blvd Unit 210
- 2018 Griffith pk Blvd Unit 211
- 2018 Griffith pk Blvd Unit 212
- 2018 Griffith pk Blvd Unit 213
- 2018 Griffith pk Blvd Unit 120
- 2018 Griffith pk Blvd Unit 121
- 2018 Griffith pk Blvd Unit 123
- 2018 Griffith pk Blvd Unit 124
- 2018 Griffith pk Blvd Unit 125
- 2018 Griffith pk Blvd Unit 126
- 2018 Griffith pk Blvd Unit 214
- 2018 Griffith pk Blvd Unit 215
- 2018 Griffith pk Blvd Unit 216
- 2018 Griffith pk Blvd Unit 217
- 2018 Griffith pk Blvd Unit 218
- 2018 Griffith pk Blvd Unit 320
- 2018 Griffith pk Blvd Unit 321
- 2018 Griffith pk Blvd Unit 322
- 2018 Griffith pk Blvd Unit 323
- 2018 Griffith pk Blvd Unit 219