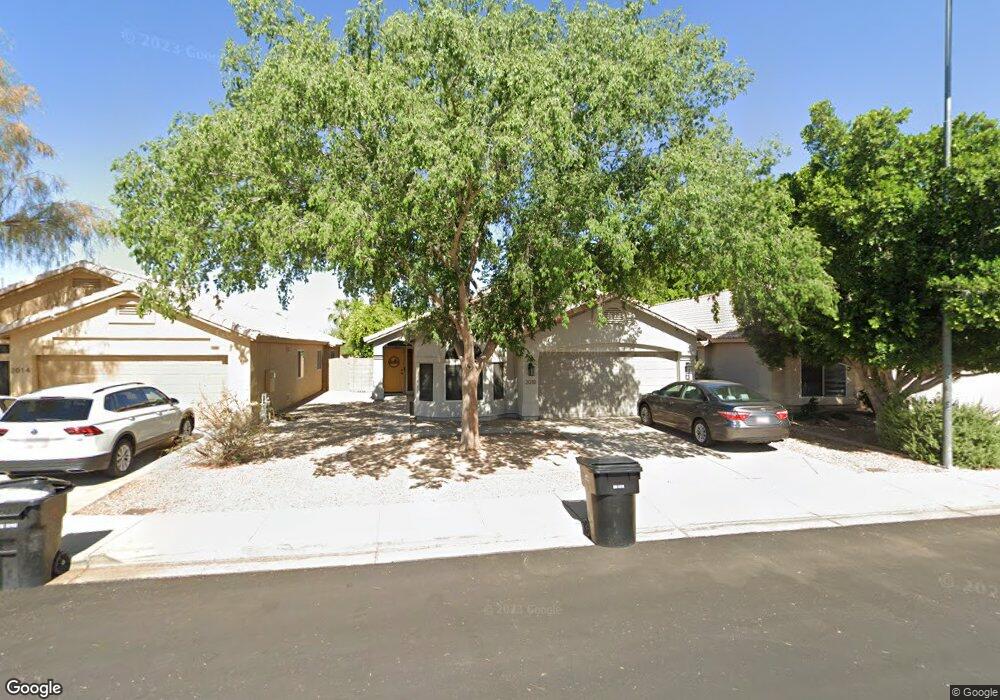
2018 N Los Alamos Mesa, AZ 85213
Rancho de Arboleda NeighborhoodEstimated Value: $367,527 - $441,000
--
Bed
2
Baths
1,511
Sq Ft
$277/Sq Ft
Est. Value
About This Home
This home is located at 2018 N Los Alamos, Mesa, AZ 85213 and is currently estimated at $417,882, approximately $276 per square foot. 2018 N Los Alamos is a home located in Maricopa County with nearby schools including Ishikawa Elementary School, Franklin at Brimhall Elementary School, and Franklin West Elementary School.
Ownership History
Date
Name
Owned For
Owner Type
Purchase Details
Closed on
Jun 5, 2001
Sold by
Chacon Thomas R and Chacon Robin Y
Bought by
Hatch Wade D and Hatch Shawn
Current Estimated Value
Home Financials for this Owner
Home Financials are based on the most recent Mortgage that was taken out on this home.
Original Mortgage
$135,584
Outstanding Balance
$51,684
Interest Rate
7.15%
Mortgage Type
FHA
Estimated Equity
$366,198
Purchase Details
Closed on
Jul 25, 1997
Sold by
D R Horton Inc
Bought by
Chacon Thomas R and Chacon Robin Y
Home Financials for this Owner
Home Financials are based on the most recent Mortgage that was taken out on this home.
Original Mortgage
$109,956
Interest Rate
7.7%
Mortgage Type
FHA
Create a Home Valuation Report for This Property
The Home Valuation Report is an in-depth analysis detailing your home's value as well as a comparison with similar homes in the area
Home Values in the Area
Average Home Value in this Area
Purchase History
| Date | Buyer | Sale Price | Title Company |
|---|---|---|---|
| Hatch Wade D | $137,500 | Security Title Agency | |
| Chacon Thomas R | $111,630 | First American Title |
Source: Public Records
Mortgage History
| Date | Status | Borrower | Loan Amount |
|---|---|---|---|
| Open | Hatch Wade D | $135,584 | |
| Previous Owner | Chacon Thomas R | $109,956 |
Source: Public Records
Tax History Compared to Growth
Tax History
| Year | Tax Paid | Tax Assessment Tax Assessment Total Assessment is a certain percentage of the fair market value that is determined by local assessors to be the total taxable value of land and additions on the property. | Land | Improvement |
|---|---|---|---|---|
| 2025 | $1,525 | $18,099 | -- | -- |
| 2024 | $1,541 | $17,237 | -- | -- |
| 2023 | $1,541 | $29,910 | $5,980 | $23,930 |
| 2022 | $1,508 | $22,850 | $4,570 | $18,280 |
| 2021 | $1,545 | $21,820 | $4,360 | $17,460 |
| 2020 | $1,524 | $19,680 | $3,930 | $15,750 |
| 2019 | $1,413 | $18,030 | $3,600 | $14,430 |
| 2018 | $1,349 | $17,020 | $3,400 | $13,620 |
| 2017 | $1,307 | $15,780 | $3,150 | $12,630 |
| 2016 | $1,283 | $15,460 | $3,090 | $12,370 |
| 2015 | $1,210 | $14,420 | $2,880 | $11,540 |
Source: Public Records
Map
Nearby Homes
- 2015 N Los Alamos
- 2050 N 28th Place
- 3026 E Backus Rd
- 3041 E Backus Rd
- 3305 E Kenwood St
- 2328 N Roca
- 2251 N 32nd St Unit 27
- 3446 E Knoll St
- 3452 E Jaeger Cir
- 3233 E Indigo Cir Unit 167
- 2854 E Mallory St
- 2528 E Mckellips Rd Unit 74
- 2528 E Mckellips Rd Unit 146
- 2528 E Mckellips Rd Unit 15
- 2360 N Yale
- 3060 E Hope St
- 3211 E Hope Cir
- 1515 N Los Alamos Cir
- 3039 E Hope St
- 2121 N Orchard --
- 2022 N Los Alamos
- 2014 N Los Alamos
- 2026 N Los Alamos
- 2008 N Los Alamos
- 2032 N Los Alamos
- 3045 E Knoll St
- 2019 N Los Alamos
- 2068 N Los Alamos
- 2009 N Los Alamos
- 3049 E Knoll St
- 2044 N Los Alamos
- 3046 E Knoll St
- 2050 N Los Alamos
- 3050 E Knoll St
- 3059 E Knoll St
- 3054 E Knoll St
- 2035 N 30th St
- 2054 N Los Alamos
- 2023 N 30th St
- 2027 N 30th St