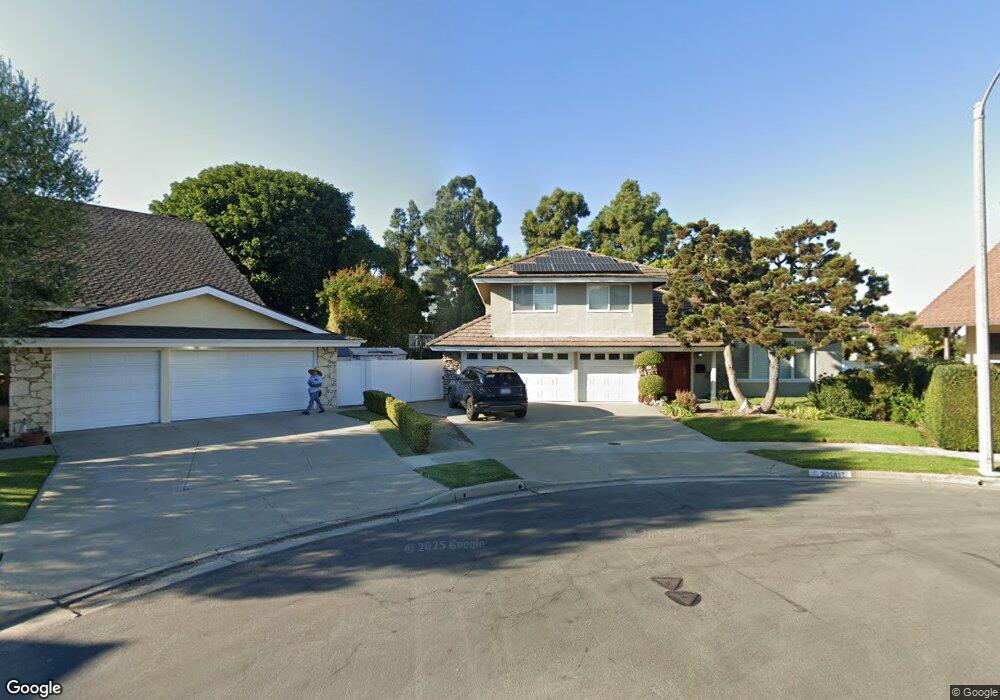
20181 Tanbark Cir Huntington Beach, CA 92646
Southeast NeighborhoodEstimated Value: $1,720,000 - $2,070,000
4
Beds
3
Baths
2,349
Sq Ft
$803/Sq Ft
Est. Value
About This Home
This home is located at 20181 Tanbark Cir, Huntington Beach, CA 92646 and is currently estimated at $1,886,374, approximately $803 per square foot. 20181 Tanbark Cir is a home located in Orange County with nearby schools including Ralph E. Hawes Elementary School, Isaac L. Sowers Middle School, and Edison High School.
Ownership History
Date
Name
Owned For
Owner Type
Purchase Details
Closed on
Apr 28, 2001
Sold by
Johnson Adam L and Kamemaru Keri K
Bought by
Johnson Adam L and Kanemaru Keri K
Current Estimated Value
Home Financials for this Owner
Home Financials are based on the most recent Mortgage that was taken out on this home.
Original Mortgage
$83,300
Interest Rate
6.92%
Purchase Details
Closed on
Feb 5, 1998
Sold by
Booth John E and Booth Sheryl L
Bought by
Johnson Adam L and Kanemaru Keri K
Home Financials for this Owner
Home Financials are based on the most recent Mortgage that was taken out on this home.
Original Mortgage
$296,000
Outstanding Balance
$52,354
Interest Rate
6.99%
Estimated Equity
$1,834,020
Create a Home Valuation Report for This Property
The Home Valuation Report is an in-depth analysis detailing your home's value as well as a comparison with similar homes in the area
Home Values in the Area
Average Home Value in this Area
Purchase History
| Date | Buyer | Sale Price | Title Company |
|---|---|---|---|
| Johnson Adam L | -- | First American Title Ins Co | |
| Johnson Adam L | $370,000 | North American Title Co |
Source: Public Records
Mortgage History
| Date | Status | Borrower | Loan Amount |
|---|---|---|---|
| Closed | Johnson Adam L | $83,300 | |
| Open | Johnson Adam L | $296,000 | |
| Closed | Johnson Adam L | $370,000 |
Source: Public Records
Tax History Compared to Growth
Tax History
| Year | Tax Paid | Tax Assessment Tax Assessment Total Assessment is a certain percentage of the fair market value that is determined by local assessors to be the total taxable value of land and additions on the property. | Land | Improvement |
|---|---|---|---|---|
| 2025 | $6,701 | $590,795 | $401,518 | $189,277 |
| 2024 | $6,701 | $579,211 | $393,645 | $185,566 |
| 2023 | $6,549 | $567,854 | $385,926 | $181,928 |
| 2022 | $6,376 | $556,720 | $378,359 | $178,361 |
| 2021 | $6,257 | $545,804 | $370,940 | $174,864 |
| 2020 | $6,215 | $540,208 | $367,137 | $173,071 |
| 2019 | $6,141 | $529,616 | $359,938 | $169,678 |
| 2018 | $6,045 | $519,232 | $352,881 | $166,351 |
| 2017 | $5,964 | $509,051 | $345,961 | $163,090 |
| 2016 | $5,700 | $499,070 | $339,177 | $159,893 |
| 2015 | $5,644 | $491,574 | $334,082 | $157,492 |
| 2014 | $5,525 | $481,945 | $327,538 | $154,407 |
Source: Public Records
Map
Nearby Homes
- 10172 Stonybrook Dr
- 20392 Redwood Ln
- 20442 Craimer Ln
- 19867 Piccadilly Ln
- 19880 Berkshire Ln
- 19941 Carmania Ln
- 19922 Carmania Ln
- 19860 Claremont Ln
- 2741 Sandpiper Dr
- 9695 Adams Ave
- 9745 Cornwall Dr
- 9831 Continental Dr
- 19774 Cambridge Ln
- 10101 Theseus Dr
- 19843 Coventry Ln
- 2761 Sandpiper Dr
- 9667 Durham Dr
- 19854 Leighton Ln
- 2055 Calvert Ave
- 9522 Yellowstone Dr
- 20191 Tanbark Cir
- 20182 Tanbark Cir
- 10090 Adams Ave
- 20192 Tanbark Cir
- 20201 Tanbark Cir
- 20192 Princeton Cir
- 10121 Meredith Dr
- 20182 Princeton Cir
- 20202 Princeton Cir
- 10131 Meredith Dr
- 20151 Viva Cir
- 10102 Meredith Dr
- 10112 Meredith Dr
- 10092 Meredith Dr
- 20161 Viva Cir
- 10082 Meredith Dr
- 10122 Meredith Dr
- 20181 Princeton Cir
- 10072 Meredith Dr
- 10141 Meredith Dr