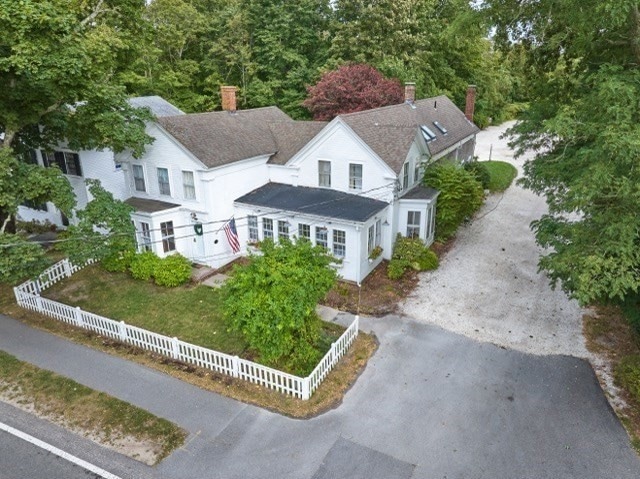
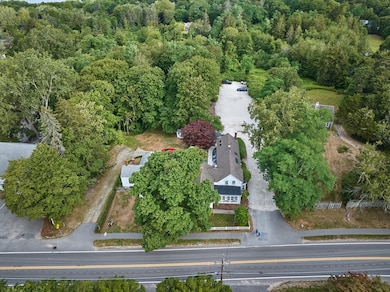
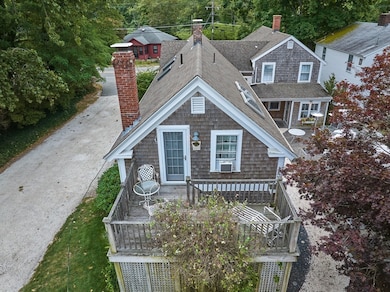
2019 Main St Brewster, MA 02631
Estimated payment $6,490/month
Highlights
- Beach Front
- No HOA
- Cooling Available
- Nauset Regional High School Rated A-
- Walking Distance to Water
- Level Lot
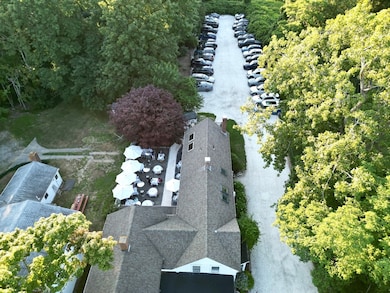
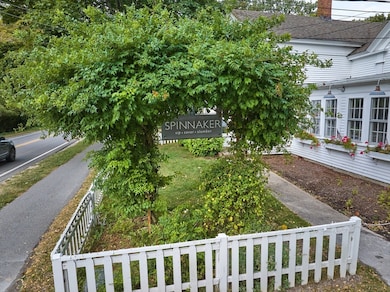
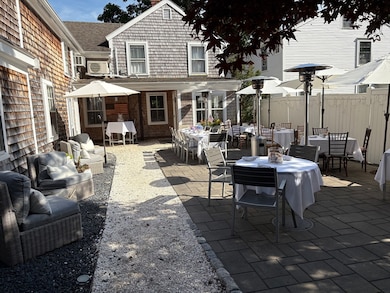
About This Home
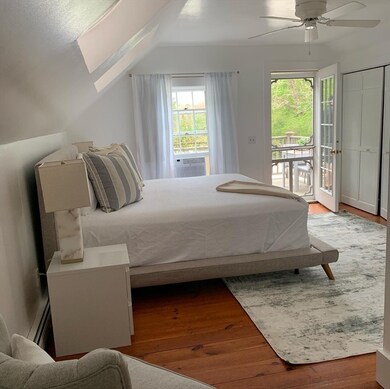
The property includes 5 bedrooms with en-suite bathrooms, a paver patio with hydrangeas and charm galore, and a large shell driveway.The property is within walking distance to the beach and can provide excellent work/life balance. Presently used as a restaurant.
Listing Agent
Chuck Carey
Carey Commerical, Inc. Listed on: 12/05/2025
Home Details
Home Type
- Single Family
Est. Annual Taxes
- $3,772
Year Built
- Built in 1861
Lot Details
- 0.62 Acre Lot
- Beach Front
- Level Lot
- Property is zoned RM
Home Design
- 3,233 Sq Ft Home
- Split Level Home
Bedrooms and Bathrooms
- 5 Bedrooms
Parking
- 32 Open Parking Spaces
- Off-Street Parking
Outdoor Features
- Walking Distance to Water
Utilities
- Cooling Available
- Heating Available
- Private Sewer
Community Details
- No Home Owners Association
Listing and Financial Details
- Assessor Parcel Number 2245745
Map
Home Values in the Area
Average Home Value in this Area
Tax History
| Year | Tax Paid | Tax Assessment Tax Assessment Total Assessment is a certain percentage of the fair market value that is determined by local assessors to be the total taxable value of land and additions on the property. | Land | Improvement |
|---|---|---|---|---|
| 2025 | $3,618 | $525,800 | $267,300 | $258,500 |
| 2024 | $3,734 | $548,300 | $257,000 | $291,300 |
| 2023 | $3,702 | $529,600 | $249,600 | $280,000 |
| 2022 | $3,489 | $444,500 | $217,200 | $227,300 |
| 2021 | $3,793 | $442,100 | $217,200 | $224,900 |
| 2020 | $6,145 | $437,700 | $217,200 | $220,500 |
| 2019 | $6,899 | $433,300 | $217,200 | $216,100 |
| 2018 | $3,439 | $416,300 | $217,200 | $199,100 |
| 2017 | $3,444 | $410,500 | $217,200 | $193,300 |
| 2016 | $3,394 | $402,600 | $213,100 | $189,500 |
| 2015 | $3,253 | $393,800 | $208,900 | $184,900 |
Property History
| Date | Event | Price | List to Sale | Price per Sq Ft |
|---|---|---|---|---|
| 12/05/2025 12/05/25 | For Sale | $1,200,000 | -- | $371 / Sq Ft |
Purchase History
| Date | Type | Sale Price | Title Company |
|---|---|---|---|
| Not Resolvable | $524,900 | -- | |
| Deed | -- | -- |
Mortgage History
| Date | Status | Loan Amount | Loan Type |
|---|---|---|---|
| Open | $345,000 | Closed End Mortgage | |
| Previous Owner | $250,000 | Commercial | |
| Previous Owner | $30,000 | Commercial |
Source: MLS Property Information Network (MLS PIN)
MLS Number: 73460218
APN: BREW-000067-000000-000004
Disclaimer: Certain information contained herein is derived from information provided by parties other than Homes.com. All information provided is deemed reliable, but is not guaranteed to be accurate and should be independently verified.
![]() The property listing data and information, or the Images, set forth herein were provided to MLS Property Information Network, Inc. from third party sources, including sellers, lessors and public records, and were compiled by MLS Property Information Network, Inc. The property listing data and information, and the Images, are for the personal, non-commercial use of consumers having a good faith interest in purchasing or leasing listed properties of the type displayed to them and may not be used for any purpose other than to identify prospective properties which such consumers may have a good faith interest in purchasing or leasing. MLS Property Information Network, Inc. and its subscribers disclaim any and all representations and warranties as to the accuracy of the property listing data and information, or as to the accuracy of any of the Images, set forth herein.
The property listing data and information, or the Images, set forth herein were provided to MLS Property Information Network, Inc. from third party sources, including sellers, lessors and public records, and were compiled by MLS Property Information Network, Inc. The property listing data and information, and the Images, are for the personal, non-commercial use of consumers having a good faith interest in purchasing or leasing listed properties of the type displayed to them and may not be used for any purpose other than to identify prospective properties which such consumers may have a good faith interest in purchasing or leasing. MLS Property Information Network, Inc. and its subscribers disclaim any and all representations and warranties as to the accuracy of the property listing data and information, or as to the accuracy of any of the Images, set forth herein.
- 1861 Main St
- 18 Juniper Cir Unit 18
- 1580 Main St
- 240 Robbins Hill Rd
- 103 Trevor Ln Unit 103
- 20 Spring Ln
- 87 N Pond Dr
- 39 Spruce Run Dr
- 958 Long Pond Rd
- 81 Fletcher Ln Unit H
- 81 Fletcher Ln Unit H
- 429 Paines Creek Rd
- 100 Fletcher Ln Unit E
- 398 Lund Farm Way
- 235 Old Chatham Rd
- 0 Old Chatham Rd
- 204 Eaton Ln Unit 204
- 14 Howland Cir Unit 14
- 184 Barons Way
- 16 Commons Way
- 873 Harwich Rd
- 5 Commons Way
- 77 Governor Bradford Rd Unit B
- 19 West Rd
- 80 Cranberry Hwy Unit 1
- 328 Bank St
- 328 Bank St Unit ST
- 328 Bank St Unit STH
- 16 Carlton Rd
- 101 Monomoyic Way
- 14 Colonial Rd
- 11 Millers Rd
- 12 Seavers Rd
- 0000 Unspecified
- 5 Thistle Cir Unit 5
- 6 Lauries Ln
- 3 Aspinet Rd Unit 3
- 483 Route 28
- 481 Buck Island Rd Unit 11F
- 2 Beatrice Ln

Ask me questions while you tour the home.