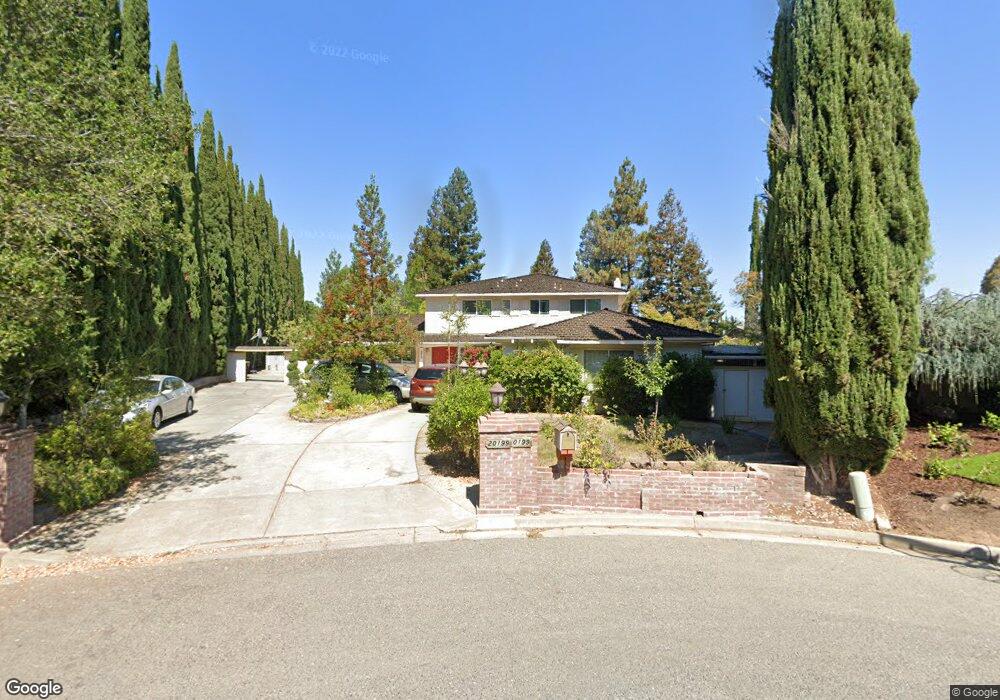
20199 Guava Ct Saratoga, CA 95070
Blue Hills NeighborhoodEstimated Value: $3,973,000 - $4,341,000
5
Beds
3
Baths
2,479
Sq Ft
$1,676/Sq Ft
Est. Value
About This Home
This home is located at 20199 Guava Ct, Saratoga, CA 95070 and is currently estimated at $4,155,360, approximately $1,676 per square foot. 20199 Guava Ct is a home located in Santa Clara County with nearby schools including Blue Hills Elementary School, Joaquin Miller Middle, and Lynbrook High School.
Ownership History
Date
Name
Owned For
Owner Type
Purchase Details
Closed on
Jan 24, 2020
Sold by
Fong William R and Fong Marie M
Bought by
Fong William R and Fong Marie M
Current Estimated Value
Purchase Details
Closed on
Feb 2, 2007
Sold by
Fong Marie M
Bought by
Fong William R and Fong Marie M
Purchase Details
Closed on
Jul 9, 2004
Sold by
Fong William R
Bought by
Fong Marie M
Purchase Details
Closed on
Oct 4, 2000
Sold by
Strudwick Paul A and Strudwick Janet S
Bought by
Fong William R and Fong Marie M
Home Financials for this Owner
Home Financials are based on the most recent Mortgage that was taken out on this home.
Original Mortgage
$961,500
Outstanding Balance
$363,907
Interest Rate
8.45%
Estimated Equity
$3,791,453
Purchase Details
Closed on
Apr 19, 1994
Sold by
Benjamin Daniel and Benjamin Violet
Bought by
Strudwick Paul A and Strudwick Janet S
Home Financials for this Owner
Home Financials are based on the most recent Mortgage that was taken out on this home.
Original Mortgage
$290,000
Interest Rate
4.5%
Create a Home Valuation Report for This Property
The Home Valuation Report is an in-depth analysis detailing your home's value as well as a comparison with similar homes in the area
Home Values in the Area
Average Home Value in this Area
Purchase History
| Date | Buyer | Sale Price | Title Company |
|---|---|---|---|
| Fong William R | -- | Fidelity National Title Co | |
| Fong William R | -- | None Available | |
| Fong Marie M | -- | -- | |
| Fong William R | $1,282,000 | Chicago Title Co | |
| Strudwick Paul A | $470,000 | North American Title Co Inc |
Source: Public Records
Mortgage History
| Date | Status | Borrower | Loan Amount |
|---|---|---|---|
| Open | Fong William R | $961,500 | |
| Previous Owner | Strudwick Paul A | $290,000 |
Source: Public Records
Tax History Compared to Growth
Tax History
| Year | Tax Paid | Tax Assessment Tax Assessment Total Assessment is a certain percentage of the fair market value that is determined by local assessors to be the total taxable value of land and additions on the property. | Land | Improvement |
|---|---|---|---|---|
| 2025 | $22,091 | $1,854,563 | $1,356,158 | $498,405 |
| 2024 | $22,091 | $1,818,200 | $1,329,567 | $488,633 |
| 2023 | $21,890 | $1,782,550 | $1,303,498 | $479,052 |
| 2022 | $21,410 | $1,747,599 | $1,277,940 | $469,659 |
| 2021 | $21,227 | $1,713,333 | $1,252,883 | $460,450 |
| 2020 | $20,893 | $1,695,766 | $1,240,037 | $455,729 |
| 2019 | $20,368 | $1,662,517 | $1,215,723 | $446,794 |
| 2018 | $19,851 | $1,629,920 | $1,191,886 | $438,034 |
| 2017 | $20,078 | $1,597,962 | $1,168,516 | $429,446 |
| 2016 | $19,443 | $1,566,630 | $1,145,604 | $421,026 |
| 2015 | $19,317 | $1,543,098 | $1,128,396 | $414,702 |
| 2014 | $18,824 | $1,512,872 | $1,106,293 | $406,579 |
Source: Public Records
Map
Nearby Homes
- 12637 Lido Way
- 12790 Glen Arbor Ct
- 19817 Veronica Dr
- 18396 Mill Ct
- 12584 Arroyo de Arguello
- 20290 Argonaut Dr
- 20077 Ljepava Dr
- 20717 Meadow Oak Rd
- 20811 Norada Ct
- 19921 Charters Ave
- 19740 Via Escuela Dr
- 1681 Danromas Way
- 19662 Via Grande Dr
- 6893 Chantel Ct
- 6886 Chantel Ct
- 13010 Glen Brae Dr
- 13199 Paramount Dr
- 6944 Chantel Ct
- 19522 Via Real Dr
- 7150 Rainbow Dr Unit 42
- 20187 Guava Ct
- 20197 Guava Ct
- 12500 De Sanka Ave
- 12488 De Sanka Ave
- 20175 Guava Ct
- 12470 De Sanka Ave
- 20200 Cherry Ln
- 20190 Cherry Ln
- 20180 Cherry Ln
- 20163 Guava Ct
- 12454 De Sanka Ave
- 12487 Fredericksburg Dr
- 12465 Fredericksburg Dr
- 20170 Cherry Ln
- 12500 Fredericksburg Dr
- 12443 Fredericksburg Dr
- 12501 De Sanka Ave
- 12485 De Sanka Ave
- 20151 Guava Ct
- 12471 De Sanka Ave