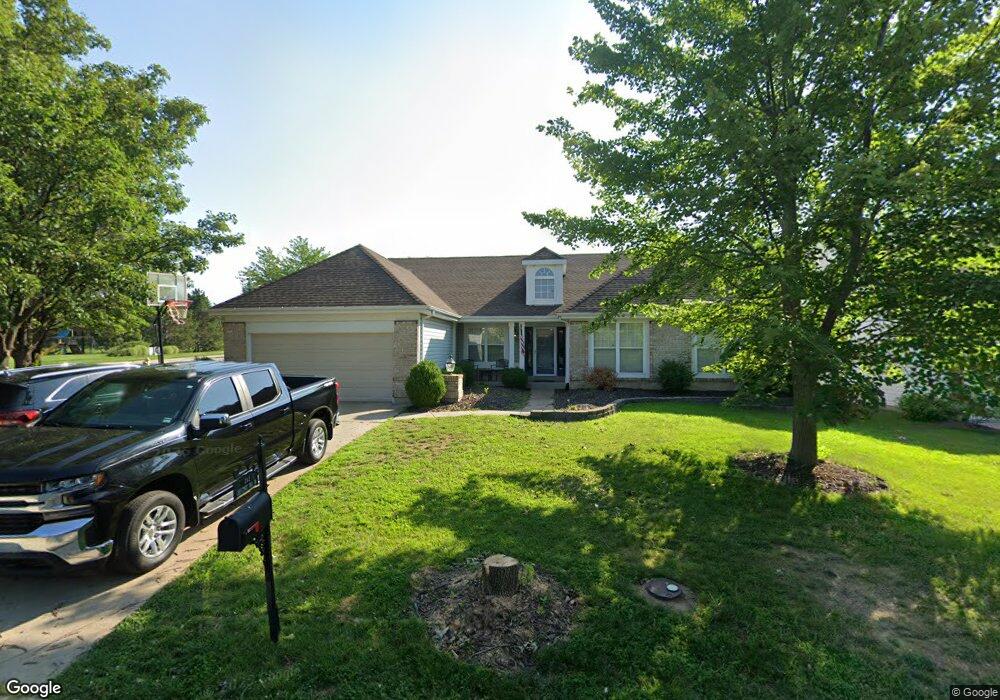
202 Chestnut Hill Dr O Fallon, MO 63368
Estimated Value: $416,691 - $458,000
3
Beds
2
Baths
2,167
Sq Ft
$202/Sq Ft
Est. Value
About This Home
This home is located at 202 Chestnut Hill Dr, O Fallon, MO 63368 and is currently estimated at $436,923, approximately $201 per square foot. 202 Chestnut Hill Dr is a home located in St. Charles County with nearby schools including Crossroads Elementary School, Frontier Middle School, and Liberty High School.
Ownership History
Date
Name
Owned For
Owner Type
Purchase Details
Closed on
Jul 31, 2019
Sold by
Brown Jeffrey S and Brown Deborah A
Bought by
Hickey Carrissa and Hickey John
Current Estimated Value
Home Financials for this Owner
Home Financials are based on the most recent Mortgage that was taken out on this home.
Original Mortgage
$245,471
Outstanding Balance
$214,093
Interest Rate
3.5%
Mortgage Type
FHA
Estimated Equity
$222,830
Purchase Details
Closed on
Feb 18, 2008
Sold by
Caraway Linda K
Bought by
Brown Jeffrey S and Brown Deborah A
Home Financials for this Owner
Home Financials are based on the most recent Mortgage that was taken out on this home.
Original Mortgage
$280,000
Interest Rate
5.88%
Mortgage Type
Purchase Money Mortgage
Purchase Details
Closed on
Aug 4, 2000
Sold by
Mayer Custom Homes Inc
Bought by
Caraway Linda K
Home Financials for this Owner
Home Financials are based on the most recent Mortgage that was taken out on this home.
Original Mortgage
$145,200
Interest Rate
8.22%
Mortgage Type
FHA
Create a Home Valuation Report for This Property
The Home Valuation Report is an in-depth analysis detailing your home's value as well as a comparison with similar homes in the area
Home Values in the Area
Average Home Value in this Area
Purchase History
| Date | Buyer | Sale Price | Title Company |
|---|---|---|---|
| Hickey Carrissa | -- | None Available | |
| Brown Jeffrey S | $280,000 | Insured Title Agency Llc | |
| Caraway Linda K | -- | -- |
Source: Public Records
Mortgage History
| Date | Status | Borrower | Loan Amount |
|---|---|---|---|
| Open | Hickey Carrissa | $245,471 | |
| Previous Owner | Brown Jeffrey S | $280,000 | |
| Previous Owner | Caraway Linda K | $145,200 |
Source: Public Records
Tax History Compared to Growth
Tax History
| Year | Tax Paid | Tax Assessment Tax Assessment Total Assessment is a certain percentage of the fair market value that is determined by local assessors to be the total taxable value of land and additions on the property. | Land | Improvement |
|---|---|---|---|---|
| 2025 | $4,262 | $69,761 | -- | -- |
| 2023 | $4,266 | $62,252 | $0 | $0 |
| 2022 | $4,112 | $55,956 | $0 | $0 |
| 2021 | $4,121 | $55,956 | $0 | $0 |
| 2020 | $4,199 | $54,820 | $0 | $0 |
| 2019 | $3,942 | $54,820 | $0 | $0 |
| 2018 | $3,817 | $50,511 | $0 | $0 |
| 2017 | $3,791 | $50,511 | $0 | $0 |
| 2016 | $3,542 | $45,267 | $0 | $0 |
| 2015 | $3,490 | $45,267 | $0 | $0 |
| 2014 | $3,070 | $42,708 | $0 | $0 |
Source: Public Records
Map
Nearby Homes
- 612 Thornridge Dr
- 318 Copper Tree Ct
- 243 Chestnut Hill Dr
- 258 Chestnut Hill Dr
- 701 Balcarra Dr
- 107 Wake Forest Dr
- 702 Balcarra Dr
- 112 Wake Forest Place
- Rosemont Plan at Cedarstone - Heritage Collections
- Windsor Plan at Cedarstone - Heritage Collections
- Davenport Plan at Cedarstone - Heritage Collections
- Sierra Universal Design Plan at Cedarstone - Heritage Collections
- Lancaster Plan at Cedarstone - Heritage Collections
- Chesapeake Plan at Cedarstone - Heritage Collections
- Braxton Plan at Cedarstone - Heritage Collections
- Pierce Plan at Cedarstone - Heritage Collections
- Sierra Plan at Cedarstone - Heritage Collections
- Portsmouth Plan at Cedarstone - Heritage Collections
- Bridgeport Plan at Cedarstone - Heritage Collections
- 116 Cedarstone Dr
- 204 Chestnut Hill Dr
- 103 Timber Meadows Dr
- 206 Chestnut Hill Dr
- 105 Timber Meadows Dr
- 1 Chestnut Hill Ct
- 602 Thornridge Dr
- 208 Chestnut Hill Dr
- 107 Timber Meadows Dr
- 2 Chestnut Hill Ct
- 604 Thornridge Dr
- 3 Chestnut Hill Ct
- 210 Chestnut Hill Dr
- 606 Thornridge Dr
- 109 Timber Meadows Dr
- 104 Timber Meadows Dr
- 102 Timber Meadows Dr
- 4 Chestnut Hill Ct
- 106 Timber Meadows Dr
- 209 Chestnut Hill Dr
- 5 Chestnut Hill Ct