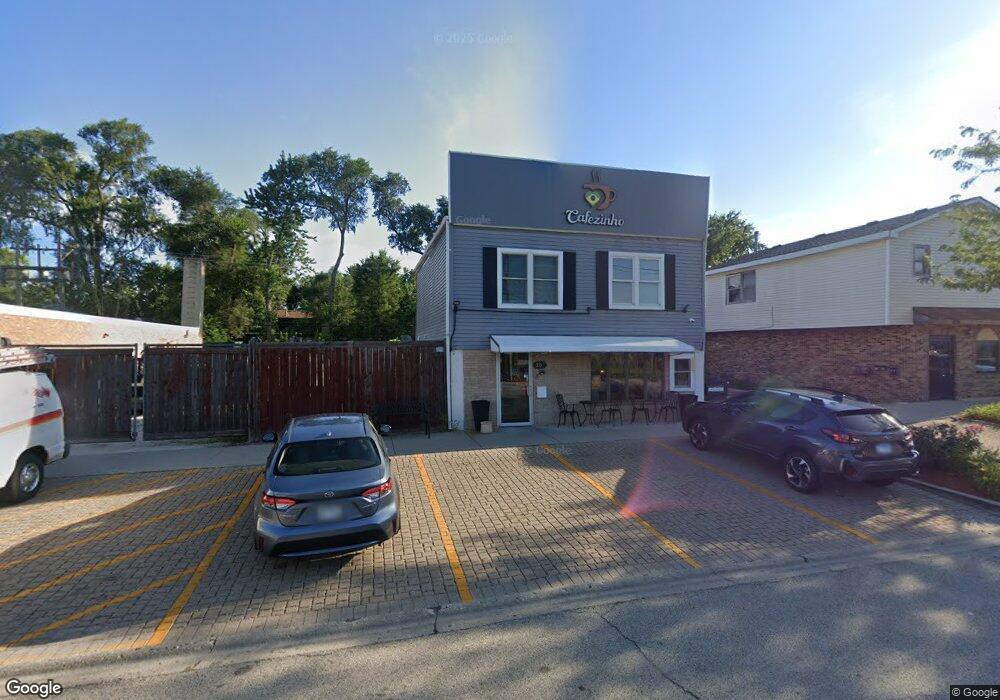
202 E Main St Round Lake Park, IL 60073
Estimated Value: $245,801 - $259,000
--
Bed
--
Bath
1,600
Sq Ft
$158/Sq Ft
Est. Value
About This Home
This home is located at 202 E Main St, Round Lake Park, IL 60073 and is currently estimated at $252,401, approximately $157 per square foot. 202 E Main St is a home located in Lake County with nearby schools including W.J. Murphy Elementary School, John T. Magee Middle School, and Round Lake High School.
Ownership History
Date
Name
Owned For
Owner Type
Purchase Details
Closed on
Feb 21, 2022
Sold by
Raeanne Mccarty
Bought by
Silco Group Llc
Current Estimated Value
Home Financials for this Owner
Home Financials are based on the most recent Mortgage that was taken out on this home.
Original Mortgage
$138,750
Outstanding Balance
$129,405
Interest Rate
3.92%
Mortgage Type
Credit Line Revolving
Estimated Equity
$122,996
Purchase Details
Closed on
Mar 8, 2013
Sold by
Robles Adolfo E
Bought by
Mccarty Raeanne
Purchase Details
Closed on
Mar 23, 2005
Sold by
Chicago Title Land Trust Co
Bought by
Robles Adolfo E and Mccarty Raeanne
Home Financials for this Owner
Home Financials are based on the most recent Mortgage that was taken out on this home.
Original Mortgage
$104,000
Interest Rate
5.61%
Mortgage Type
Commercial
Purchase Details
Closed on
Jul 16, 2001
Sold by
Fifth Third Bank
Bought by
Fifth Third Bank and Trust #2810
Create a Home Valuation Report for This Property
The Home Valuation Report is an in-depth analysis detailing your home's value as well as a comparison with similar homes in the area
Home Values in the Area
Average Home Value in this Area
Purchase History
| Date | Buyer | Sale Price | Title Company |
|---|---|---|---|
| Silco Group Llc | $185,000 | Lakeland Title Services | |
| Mccarty Raeanne | -- | None Available | |
| Robles Adolfo E | $130,000 | Blackhawk Title Services | |
| Fifth Third Bank | -- | -- |
Source: Public Records
Mortgage History
| Date | Status | Borrower | Loan Amount |
|---|---|---|---|
| Open | Silco Group Llc | $138,750 | |
| Previous Owner | Robles Adolfo E | $104,000 |
Source: Public Records
Tax History Compared to Growth
Tax History
| Year | Tax Paid | Tax Assessment Tax Assessment Total Assessment is a certain percentage of the fair market value that is determined by local assessors to be the total taxable value of land and additions on the property. | Land | Improvement |
|---|---|---|---|---|
| 2024 | $2,483 | $26,154 | $4,289 | $21,865 |
| 2023 | $2,402 | $24,003 | $3,936 | $20,067 |
| 2022 | $2,402 | $22,673 | $3,878 | $18,795 |
| 2021 | $2,560 | $21,792 | $3,727 | $18,065 |
| 2020 | $2,441 | $20,734 | $3,546 | $17,188 |
| 2019 | $2,441 | $19,892 | $3,402 | $16,490 |
| 2018 | $1,262 | $15,225 | $4,228 | $10,997 |
| 2017 | $1,221 | $14,321 | $3,977 | $10,344 |
| 2016 | $1,060 | $13,220 | $3,671 | $9,549 |
| 2015 | $971 | $12,078 | $3,354 | $8,724 |
| 2014 | $998 | $12,267 | $3,363 | $8,904 |
| 2012 | $1,061 | $12,811 | $3,512 | $9,299 |
Source: Public Records
Map
Nearby Homes
- 123 E Pineview Dr
- 121 Highmoor Dr
- 304 E Willow Dr
- 221 Kenwood Dr
- 582 Holiday Ln Unit 472
- 318 Kenwood Dr
- 175 Davis Ct
- 319 Grandview Dr
- 408 Bellevue Dr
- 407 Greenwood Dr
- 221 Hillandale St
- 4 W Tall Oak Dr
- 30 S Macgillis Dr Unit 201
- 47 S Treehouse Ln Unit 83
- 337 W Treehouse Ln Unit 112
- 321 W Whispering Oaks Ln Unit 336
- 504 Greenwood Dr
- 33 S Treehouse Ln Unit 73
- 516 Clifton Dr
- 519 Greenwood Dr
- 203 E Pineview Dr
- 125 E Pineview Dr
- 205 E Pineview Dr
- 207 E Pineview Dr
- 121 E Pineview Dr
- 209 E Pineview Dr
- 218 E Main St Unit 218
- 119 E Pineview Dr
- 211 E Pineview Dr
- 124 E Main St
- 137 E Main St
- 133 E Main St
- 117 E Pineview Dr
- 213 E Pineview Dr
- 209 E Main St
- 118 E Main St
- 202 E Pineview Dr
- 115 E Pineview Dr
- 200 E Pineview Dr
- 215 E Pineview Dr