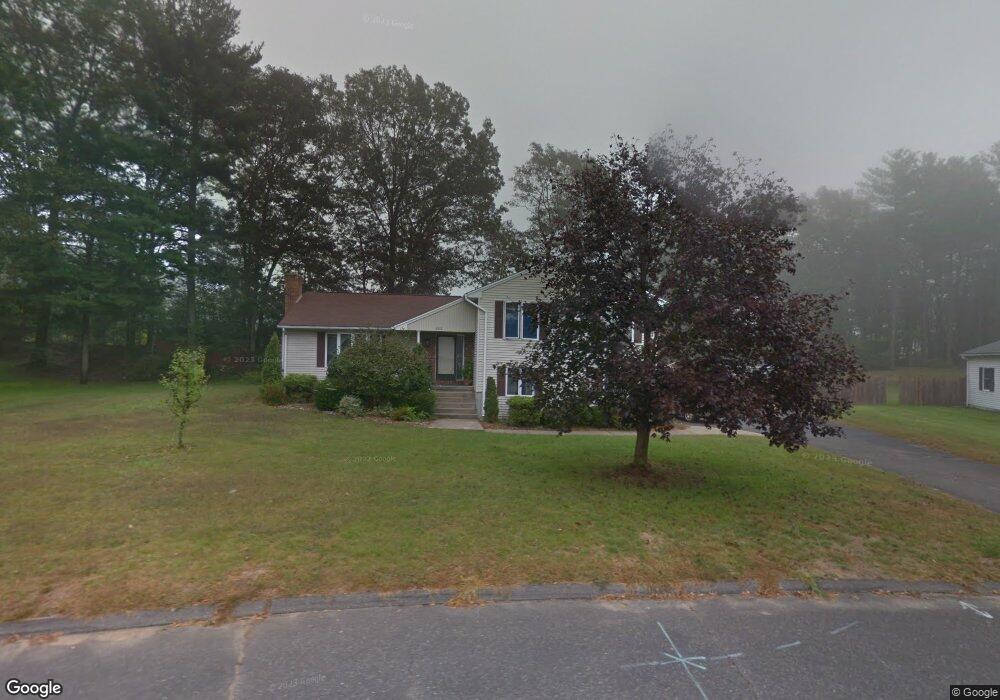
202 Erin Ln Ludlow, MA 01056
Estimated Value: $456,294 - $534,000
3
Beds
3
Baths
2,028
Sq Ft
$245/Sq Ft
Est. Value
About This Home
This home is located at 202 Erin Ln, Ludlow, MA 01056 and is currently estimated at $497,074, approximately $245 per square foot. 202 Erin Ln is a home located in Hampden County with nearby schools including East Street Elementary School, Chapin Street Elementary School, and Paul R. Baird Middle School.
Ownership History
Date
Name
Owned For
Owner Type
Purchase Details
Closed on
Feb 8, 2019
Sold by
Zielinski Paul A and Zielinski Elizabeth A
Bought by
Zielinski Elizabeth A
Current Estimated Value
Purchase Details
Closed on
Jun 27, 1997
Sold by
Park Gui S and Park Insoon
Bought by
Zielinski Paul A and Zielinski Elizabeth A
Home Financials for this Owner
Home Financials are based on the most recent Mortgage that was taken out on this home.
Original Mortgage
$152,100
Interest Rate
7.81%
Mortgage Type
Purchase Money Mortgage
Create a Home Valuation Report for This Property
The Home Valuation Report is an in-depth analysis detailing your home's value as well as a comparison with similar homes in the area
Home Values in the Area
Average Home Value in this Area
Purchase History
| Date | Buyer | Sale Price | Title Company |
|---|---|---|---|
| Zielinski Elizabeth A | -- | -- | |
| Zielinski Paul A | $169,000 | -- |
Source: Public Records
Mortgage History
| Date | Status | Borrower | Loan Amount |
|---|---|---|---|
| Previous Owner | Zielinski Paul A | $10,000 | |
| Previous Owner | Zielinski Paul A | $146,400 | |
| Previous Owner | Zielinski Paul A | $152,100 | |
| Previous Owner | Zielinski Paul A | $140,000 |
Source: Public Records
Tax History Compared to Growth
Tax History
| Year | Tax Paid | Tax Assessment Tax Assessment Total Assessment is a certain percentage of the fair market value that is determined by local assessors to be the total taxable value of land and additions on the property. | Land | Improvement |
|---|---|---|---|---|
| 2025 | $6,753 | $389,200 | $91,500 | $297,700 |
| 2024 | $6,525 | $360,700 | $91,500 | $269,200 |
| 2023 | $6,421 | $329,100 | $83,800 | $245,300 |
| 2022 | $6,127 | $306,500 | $87,300 | $219,200 |
| 2021 | $6,164 | $292,400 | $87,300 | $205,100 |
| 2020 | $5,899 | $286,100 | $85,900 | $200,200 |
| 2019 | $5,597 | $282,400 | $85,100 | $197,300 |
| 2018 | $5,226 | $274,900 | $85,100 | $189,800 |
| 2017 | $5,092 | $274,800 | $84,400 | $190,400 |
| 2016 | $5,017 | $276,700 | $89,900 | $186,800 |
| 2015 | $4,744 | $274,400 | $89,000 | $185,400 |
Source: Public Records
Map
Nearby Homes
- 33 Grimard St
- 3 Fontaine St
- 61 Massachusetts Ave
- 251 West St
- 42 Roy St
- 41 Deroche Cir
- 436 Holyoke St
- 319 West St
- 58 Mariana Ln
- 482 Holyoke St
- 166 Kendall St
- 350 West St Unit 19
- 166-168 Main St
- 201 Main St
- 98 Fuller St Unit 32
- 70 Fuller St
- 0 Fuller St Unit 73409741
- 1200 Worcester St
- 84 Fuller St Unit 1
- 298 Main St