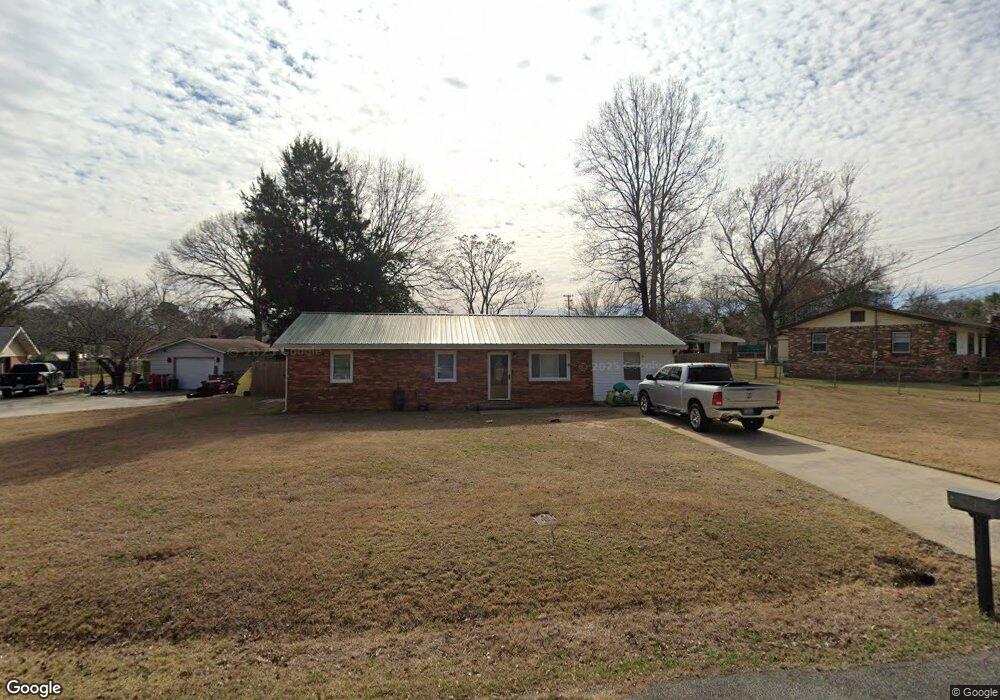
202 Mason Dr Centerville, GA 31028
Estimated Value: $177,000 - $396,000
4
Beds
2
Baths
1,633
Sq Ft
$148/Sq Ft
Est. Value
About This Home
This home is located at 202 Mason Dr, Centerville, GA 31028 and is currently estimated at $242,430, approximately $148 per square foot. 202 Mason Dr is a home located in Houston County with nearby schools including Centerville Elementary School, Thomson Middle School, and Northside High School.
Ownership History
Date
Name
Owned For
Owner Type
Purchase Details
Closed on
Mar 18, 2016
Sold by
Mcneil Tracy L
Bought by
Mcneil Andrew S
Current Estimated Value
Purchase Details
Closed on
Nov 18, 1997
Sold by
Fields Jeffrey
Bought by
Mcneil Andrew S and Tracy L*
Purchase Details
Closed on
Sep 29, 1989
Sold by
St John Weyman P & Muriel J*
Bought by
Fields Jeffrey
Purchase Details
Closed on
Aug 15, 1985
Sold by
St John Weyman P
Bought by
St John Weyman P & Muriel J*
Purchase Details
Closed on
Apr 10, 1968
Sold by
Gordon Wyatt L
Bought by
St John Weyman P
Purchase Details
Closed on
Mar 1, 1967
Sold by
Brown C E
Bought by
Gordon Wyatt L
Purchase Details
Closed on
Jan 5, 1967
Sold by
Brown J C
Bought by
Brown C E
Purchase Details
Closed on
Jan 4, 1967
Sold by
Morris Curtis Ray
Bought by
Brown J C
Purchase Details
Closed on
Feb 4, 1966
Bought by
Morris Curtis Ray
Create a Home Valuation Report for This Property
The Home Valuation Report is an in-depth analysis detailing your home's value as well as a comparison with similar homes in the area
Home Values in the Area
Average Home Value in this Area
Purchase History
| Date | Buyer | Sale Price | Title Company |
|---|---|---|---|
| Mcneil Andrew S | -- | -- | |
| Mcneil Andrew S | $54,900 | -- | |
| Fields Jeffrey | $49,900 | -- | |
| St John Weyman P & Muriel J* | -- | -- | |
| St John Weyman P | -- | -- | |
| Gordon Wyatt L | -- | -- | |
| Brown C E | -- | -- | |
| Brown J C | -- | -- | |
| Morris Curtis Ray | -- | -- |
Source: Public Records
Tax History
| Year | Tax Paid | Tax Assessment Tax Assessment Total Assessment is a certain percentage of the fair market value that is determined by local assessors to be the total taxable value of land and additions on the property. | Land | Improvement |
|---|---|---|---|---|
| 2024 | $1,733 | $49,960 | $6,800 | $43,160 |
| 2023 | $1,466 | $41,960 | $6,800 | $35,160 |
| 2022 | $820 | $35,680 | $6,000 | $29,680 |
| 2021 | $738 | $31,920 | $6,000 | $25,920 |
| 2020 | $693 | $29,840 | $6,000 | $23,840 |
| 2019 | $693 | $29,840 | $6,000 | $23,840 |
| 2018 | $693 | $29,840 | $6,000 | $23,840 |
| 2017 | $694 | $29,840 | $6,000 | $23,840 |
| 2016 | $695 | $29,840 | $6,000 | $23,840 |
| 2015 | $696 | $29,840 | $6,000 | $23,840 |
| 2014 | -- | $28,040 | $6,000 | $22,040 |
| 2013 | -- | $28,040 | $6,000 | $22,040 |
Source: Public Records
Map
Nearby Homes
- 102 Lee St Unit 117 Wilson Drive
- 102 Lee St
- 110 Lee St
- 107 Miller Ct
- 214 Mcvey Trail
- 708 N Houston Lake Blvd
- 208 Bassett St
- 132 Montrose Ln
- 202 Bassett St
- 100 Jamestown Ct
- 114 Collins Estate Ave
- 115 Montrose Ln
- 111 Shamrock Dr
- 111 Montrose Ln
- 105 Parker Ln
- 200 Collins Estate Ave
- 400 S Cambridge Dr
- 106 Bretwood Ct
- 222 Ridgewood Dr
- 109 Calvin Ct
Your Personal Tour Guide
Ask me questions while you tour the home.