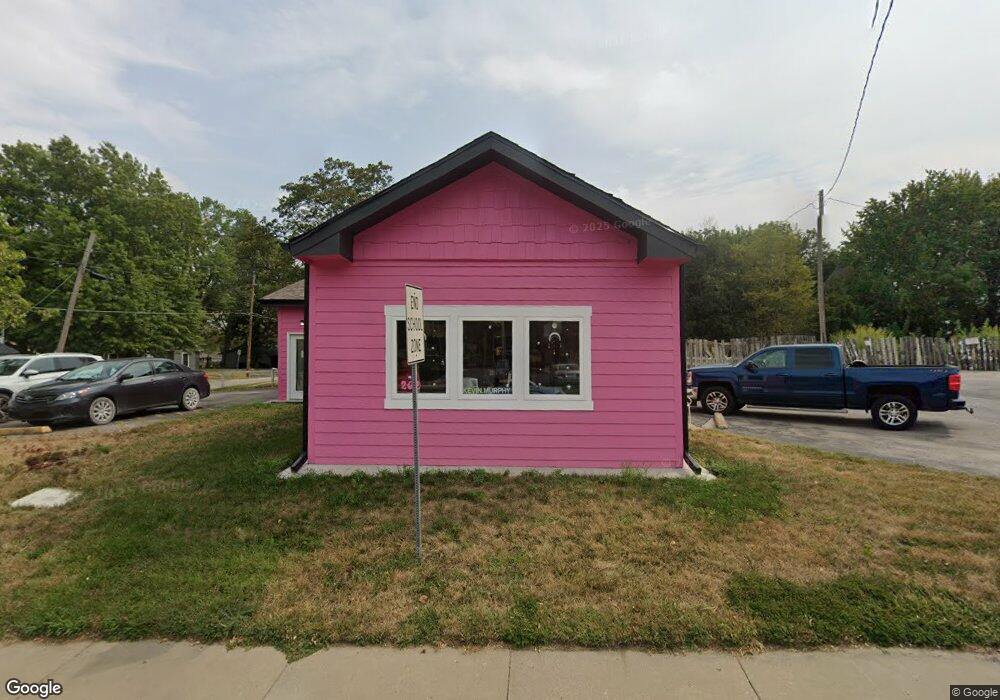
202 S Webster St Spring Hill, KS 66083
--
Bed
--
Bath
1,381
Sq Ft
6,534
Sq Ft Lot
About This Home
This home is located at 202 S Webster St, Spring Hill, KS 66083. 202 S Webster St is a home located in Johnson County with nearby schools including Spring Hill Elementary School, Spring Hill Middle School, and Spring Hill High School.
Ownership History
Date
Name
Owned For
Owner Type
Purchase Details
Closed on
Jul 26, 2023
Sold by
Baum Leigh A
Bought by
Ghomes Llc
Home Financials for this Owner
Home Financials are based on the most recent Mortgage that was taken out on this home.
Original Mortgage
$107,329
Outstanding Balance
$104,603
Interest Rate
6.67%
Mortgage Type
New Conventional
Purchase Details
Closed on
Apr 6, 2023
Sold by
Baum Michael W
Bought by
Baum Leigh A
Purchase Details
Closed on
Apr 12, 2012
Sold by
Baum Ernest W
Bought by
Baum Ernest W and Baum Michael W
Home Financials for this Owner
Home Financials are based on the most recent Mortgage that was taken out on this home.
Original Mortgage
$76,000
Interest Rate
3.92%
Mortgage Type
Future Advance Clause Open End Mortgage
Purchase Details
Closed on
Apr 11, 2012
Sold by
Tkt Properties Llc
Bought by
Baum Ernest W
Home Financials for this Owner
Home Financials are based on the most recent Mortgage that was taken out on this home.
Original Mortgage
$76,000
Interest Rate
3.92%
Mortgage Type
Future Advance Clause Open End Mortgage
Create a Home Valuation Report for This Property
The Home Valuation Report is an in-depth analysis detailing your home's value as well as a comparison with similar homes in the area
Home Values in the Area
Average Home Value in this Area
Purchase History
| Date | Buyer | Sale Price | Title Company |
|---|---|---|---|
| Ghomes Llc | -- | Security 1St Title | |
| Baum Leigh A | -- | None Listed On Document | |
| Baum Ernest W | -- | Midwest Title Company Inc | |
| Baum Ernest W | -- | Midwest Title Company Inc |
Source: Public Records
Mortgage History
| Date | Status | Borrower | Loan Amount |
|---|---|---|---|
| Open | Ghomes Llc | $107,329 | |
| Previous Owner | Baum Ernest W | $76,000 |
Source: Public Records
Tax History Compared to Growth
Tax History
| Year | Tax Paid | Tax Assessment Tax Assessment Total Assessment is a certain percentage of the fair market value that is determined by local assessors to be the total taxable value of land and additions on the property. | Land | Improvement |
|---|---|---|---|---|
| 2024 | $5,050 | $33,001 | $5,643 | $27,358 |
| 2023 | $4,804 | $32,251 | $5,433 | $26,818 |
| 2022 | $4,341 | $30,751 | $5,433 | $25,318 |
| 2021 | $4,399 | $30,751 | $5,433 | $25,318 |
| 2020 | $4,523 | $30,751 | $5,433 | $25,318 |
| 2019 | $4,271 | $29,001 | $5,433 | $23,568 |
| 2018 | $3,999 | $28,001 | $5,433 | $22,568 |
| 2017 | $3,782 | $26,251 | $5,433 | $20,818 |
| 2016 | $3,514 | $24,501 | $5,433 | $19,068 |
| 2015 | $3,303 | $23,001 | $10,868 | $12,133 |
| 2013 | -- | $21,500 | $4,180 | $17,320 |
Source: Public Records
Map
Nearby Homes
- 218 S Webster St
- 206 W Spring St
- 21660 W Johnson St
- 308 E Nichols St
- 0 W 215th St Unit HMS2527844
- 20367 W 193rd Terrace
- 404 N Washington St
- 508 W Lawrence Ave
- 512 W Lawrence Ave
- 510 W Lawrence Ave
- 514 W Lawrence Ave
- 509 W Smith St
- 513 W Smith St
- 511 W Smith St
- 515 W Smith St
- 21735 S Madison St
- 21740 S Madison St
- 21745 S Madison St
- 21750 S Madison St
- 21790 S Race St
- 105 E Hale St
- 110 S Webster St
- 100 E Hale St
- 107 E Hale St
- 108 E Hale St
- 208 S Webster St
- 209 S Webster St
- 112 E Hale St
- 107 W Hale St
- 105 S Webster St
- 113 E Hale St
- 109 W Hale St
- 109 W Hale St
- 103 S Webster St
- 114 E Hale St
- 204 S Madison St
- 111 W Hale St
- 113 E Nichols St
- 124 W Hale St
- 208 S Madison St