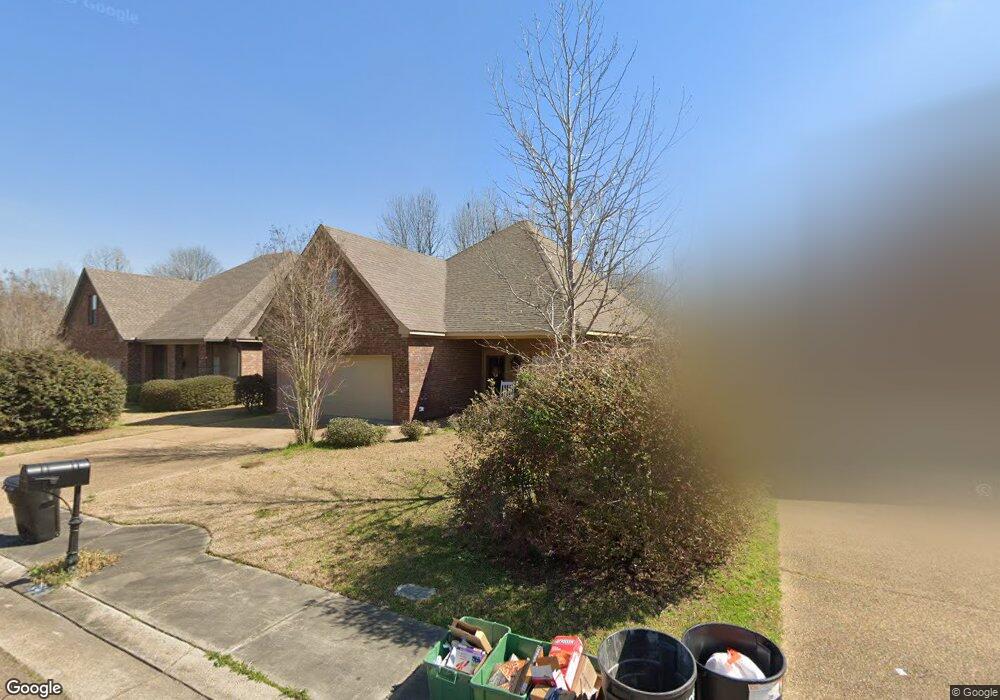
202 Seminole Ct Clinton, MS 39056
Estimated Value: $276,331 - $321,000
3
Beds
2
Baths
1,956
Sq Ft
$149/Sq Ft
Est. Value
About This Home
This home is located at 202 Seminole Ct, Clinton, MS 39056 and is currently estimated at $292,333, approximately $149 per square foot. 202 Seminole Ct is a home located in Hinds County with nearby schools including Clinton Park Elementary School, Eastside Elementary School, and Northside Elementary School.
Ownership History
Date
Name
Owned For
Owner Type
Purchase Details
Closed on
Sep 20, 2021
Sold by
Simple Solution Llc
Bought by
Gill Amanda Renee and Gill Joseph Clifton
Current Estimated Value
Home Financials for this Owner
Home Financials are based on the most recent Mortgage that was taken out on this home.
Original Mortgage
$220,500
Outstanding Balance
$200,639
Interest Rate
2.8%
Mortgage Type
Purchase Money Mortgage
Estimated Equity
$91,694
Purchase Details
Closed on
Jul 19, 2021
Sold by
Anderson Jamila Luisa
Bought by
Simple Solution Llc
Purchase Details
Closed on
Sep 13, 2010
Sold by
Kirkland Development Inc
Bought by
Anderson Jamila Luisa
Home Financials for this Owner
Home Financials are based on the most recent Mortgage that was taken out on this home.
Original Mortgage
$172,674
Interest Rate
5.33%
Mortgage Type
FHA
Create a Home Valuation Report for This Property
The Home Valuation Report is an in-depth analysis detailing your home's value as well as a comparison with similar homes in the area
Home Values in the Area
Average Home Value in this Area
Purchase History
| Date | Buyer | Sale Price | Title Company |
|---|---|---|---|
| Gill Amanda Renee | -- | None Available | |
| Simple Solution Llc | -- | None Available | |
| Anderson Jamila Luisa | -- | -- |
Source: Public Records
Mortgage History
| Date | Status | Borrower | Loan Amount |
|---|---|---|---|
| Open | Gill Amanda Renee | $220,500 | |
| Previous Owner | Anderson Jamila Luisa | $172,674 |
Source: Public Records
Tax History Compared to Growth
Tax History
| Year | Tax Paid | Tax Assessment Tax Assessment Total Assessment is a certain percentage of the fair market value that is determined by local assessors to be the total taxable value of land and additions on the property. | Land | Improvement |
|---|---|---|---|---|
| 2025 | $2,187 | $16,197 | $4,000 | $12,197 |
| 2024 | $2,187 | $16,197 | $4,000 | $12,197 |
| 2023 | $2,187 | $24,296 | $6,000 | $18,296 |
| 2022 | $3,693 | $24,296 | $6,000 | $18,296 |
| 2021 | $2,162 | $16,197 | $4,000 | $12,197 |
| 2020 | $2,111 | $15,972 | $4,000 | $11,972 |
| 2019 | $2,160 | $15,972 | $4,000 | $11,972 |
| 2018 | $2,160 | $15,972 | $4,000 | $11,972 |
| 2017 | $2,055 | $15,972 | $4,000 | $11,972 |
| 2016 | $2,055 | $15,885 | $4,000 | $11,885 |
| 2015 | $2,020 | $15,704 | $4,000 | $11,704 |
| 2014 | $1,813 | $14,303 | $4,000 | $10,303 |
Source: Public Records
Map
Nearby Homes
- 107 Trace Pointe Place
- 103 Buffalo Cove
- 1422 Huntcliff Way
- 149 Navajo Cir
- 172 Navajo Cir
- 110 Trace Pointe Place
- 114 Trace Pointe Place
- 116 Trace Pointe Place
- 102 Friars Cove
- 1219 Canterbury Ln
- 1221 Huntcliff Way
- 603 Herndon Hill
- 605 Herndon Hill
- 1203 Rockingham Dr
- 0 Huntcliff Way
- 1200 Canterbury Ln
- 305 Linda Dr
- 317A Avondale Dr
- 504 Hampton St
- 1609 Linda Dr SW
- 206 Seminole Ct Unit 27
- 206 Seminole Ct
- 0 Seminole Ct Unit Lot 24 1184912
- 0 Seminole Ct Unit Lot 23 1185556
- 0 Seminole Ct Unit lot 33 1180046
- 0 Seminole Ct Unit LOT 32 1180076
- 0 Seminole Ct Unit lot 30 1180045
- 0 Seminole Ct Unit Lot 31 1180075
- 0 Seminole Ct Unit Lot 29 1180044
- 207 Seminole Ct
- 207 Seminole Ct Unit 26
- 205 Seminole Ct
- 205 Seminole Ct Unit 28
- 195 Seminole Ct Unit 23
- 197 Seminole Ct Unit 24
- 199 Seminole Ct Unit 25
- 199 Seminole Ct
- 197 Seminole Ct
- 195 Seminole Ct
- 208 Seminole Ct Unit 25