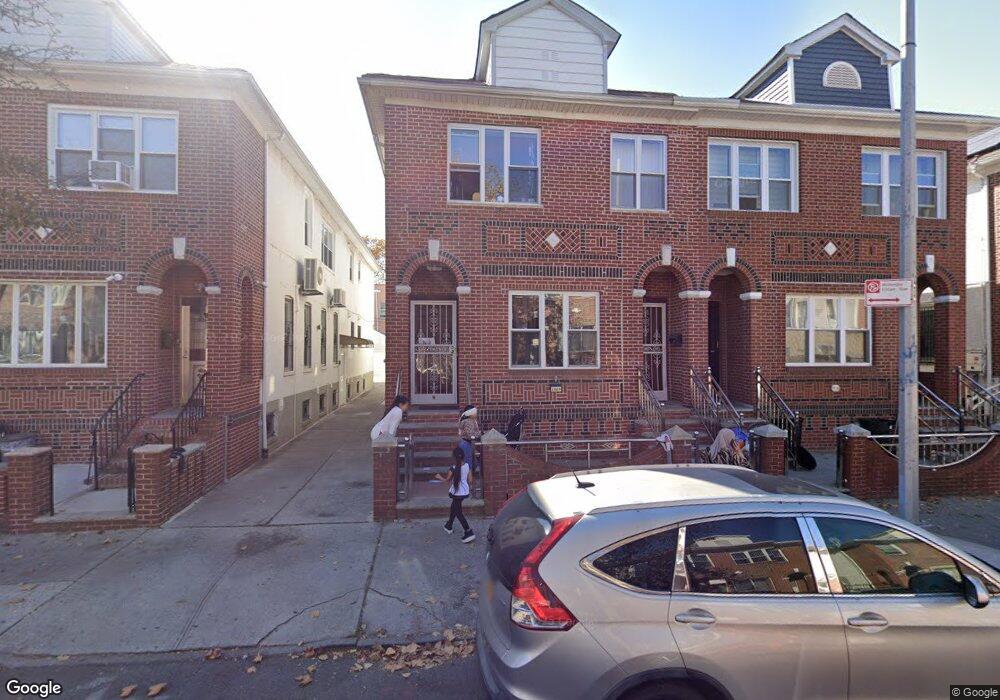
2020 72nd St Unit 2 Brooklyn, NY 11204
Bensonhurst NeighborhoodEstimated Value: $1,629,000 - $1,908,000
3
Beds
2
Baths
2,560
Sq Ft
$702/Sq Ft
Est. Value
About This Home
This home is located at 2020 72nd St Unit 2, Brooklyn, NY 11204 and is currently estimated at $1,797,044, approximately $701 per square foot. 2020 72nd St Unit 2 is a home located in Kings County with nearby schools including P.S. 247 The College Partnership Elementary School, Seth Low Intermediate School 96, and James Madison High School.
Ownership History
Date
Name
Owned For
Owner Type
Purchase Details
Closed on
Oct 16, 2023
Sold by
John Caputo Trustee and Maria Caputo Trustee
Bought by
Chen Qin and Tang Zhikai
Current Estimated Value
Home Financials for this Owner
Home Financials are based on the most recent Mortgage that was taken out on this home.
Original Mortgage
$770,000
Outstanding Balance
$755,029
Interest Rate
7.18%
Mortgage Type
Purchase Money Mortgage
Estimated Equity
$1,042,015
Purchase Details
Closed on
Oct 6, 2020
Sold by
Caputo Deceased Immacolata and Caputo Caputo
Bought by
Caputo Joseph and Joseph Caputo Irrevocable Trust
Purchase Details
Closed on
Aug 2, 1994
Sold by
Caputo Joseph and Caputo Immacolata
Bought by
Caputo Joseph and Caputo Immacolata
Home Financials for this Owner
Home Financials are based on the most recent Mortgage that was taken out on this home.
Original Mortgage
$220,000
Interest Rate
8.44%
Mortgage Type
Purchase Money Mortgage
Create a Home Valuation Report for This Property
The Home Valuation Report is an in-depth analysis detailing your home's value as well as a comparison with similar homes in the area
Home Values in the Area
Average Home Value in this Area
Purchase History
| Date | Buyer | Sale Price | Title Company |
|---|---|---|---|
| Chen Qin | $1,630,000 | -- | |
| Chen Qin | $1,630,000 | -- | |
| Caputo Joseph | -- | -- | |
| John Caputo | -- | -- | |
| Caputo Joseph | -- | -- | |
| Caputo Joseph | -- | Commonwealth Land Title Ins | |
| Caputo Joseph | -- | Commonwealth Land Title Ins |
Source: Public Records
Mortgage History
| Date | Status | Borrower | Loan Amount |
|---|---|---|---|
| Open | Chen Qin | $770,000 | |
| Closed | Chen Qin | $770,000 | |
| Previous Owner | Caputo Joseph | $220,000 |
Source: Public Records
Tax History Compared to Growth
Tax History
| Year | Tax Paid | Tax Assessment Tax Assessment Total Assessment is a certain percentage of the fair market value that is determined by local assessors to be the total taxable value of land and additions on the property. | Land | Improvement |
|---|---|---|---|---|
| 2025 | $10,395 | $79,740 | $14,820 | $64,920 |
| 2024 | $10,395 | $87,000 | $14,820 | $72,180 |
| 2023 | $9,488 | $106,200 | $14,820 | $91,380 |
| 2022 | $9,077 | $91,740 | $14,820 | $76,920 |
| 2021 | $9,539 | $92,520 | $14,820 | $77,700 |
| 2020 | $7,154 | $83,160 | $14,820 | $68,340 |
| 2019 | $8,363 | $83,160 | $14,820 | $68,340 |
| 2018 | $7,829 | $41,637 | $8,388 | $33,249 |
| 2017 | $7,639 | $40,641 | $8,228 | $32,413 |
| 2016 | $7,452 | $40,382 | $8,922 | $31,460 |
| 2015 | $4,185 | $38,097 | $12,607 | $25,490 |
| 2014 | $4,185 | $35,942 | $11,216 | $24,726 |
Source: Public Records
Map
Nearby Homes