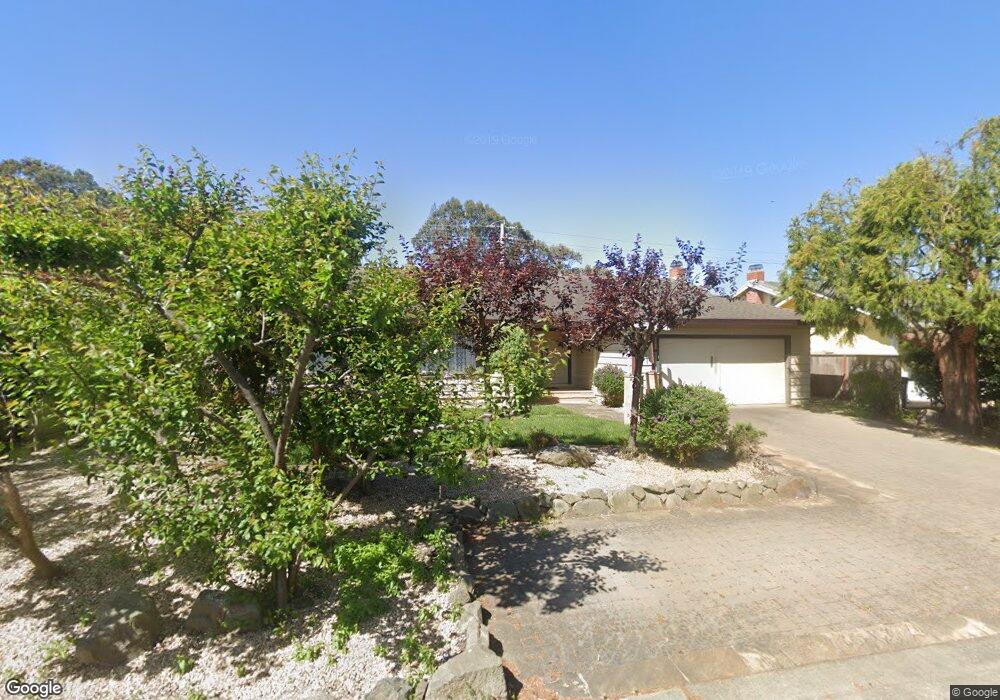
2020 Avignon Place Half Moon Bay, CA 94019
Estimated Value: $1,507,008 - $1,707,000
3
Beds
2
Baths
1,790
Sq Ft
$902/Sq Ft
Est. Value
About This Home
This home is located at 2020 Avignon Place, Half Moon Bay, CA 94019 and is currently estimated at $1,613,752, approximately $901 per square foot. 2020 Avignon Place is a home located in San Mateo County with nearby schools including El Granada Elementary School, Manuel F. Cunha Intermediate School, and Half Moon Bay High School.
Ownership History
Date
Name
Owned For
Owner Type
Purchase Details
Closed on
Oct 9, 2018
Sold by
Pelinka Janet
Bought by
Greenawall Sally and Pelinka Janet
Current Estimated Value
Purchase Details
Closed on
May 14, 1998
Sold by
Link Donald C and Link Kikuyo I
Bought by
Link Donald C and Link Kikuyo I
Create a Home Valuation Report for This Property
The Home Valuation Report is an in-depth analysis detailing your home's value as well as a comparison with similar homes in the area
Home Values in the Area
Average Home Value in this Area
Purchase History
| Date | Buyer | Sale Price | Title Company |
|---|---|---|---|
| Greenawall Sally | $116,500 | None Available | |
| Link Donald C | -- | -- |
Source: Public Records
Tax History Compared to Growth
Tax History
| Year | Tax Paid | Tax Assessment Tax Assessment Total Assessment is a certain percentage of the fair market value that is determined by local assessors to be the total taxable value of land and additions on the property. | Land | Improvement |
|---|---|---|---|---|
| 2025 | $4,170 | $291,258 | $82,847 | $208,411 |
| 2023 | $4,170 | $279,950 | $79,631 | $200,319 |
| 2022 | $3,826 | $274,462 | $78,070 | $196,392 |
| 2021 | $3,688 | $269,082 | $76,540 | $192,542 |
| 2020 | $3,687 | $266,324 | $75,756 | $190,568 |
| 2019 | $3,648 | $261,103 | $74,271 | $186,832 |
| 2018 | $3,393 | $255,984 | $72,815 | $183,169 |
| 2017 | $3,304 | $250,966 | $71,388 | $179,578 |
| 2016 | $3,260 | $246,046 | $69,989 | $176,057 |
| 2015 | $3,194 | $242,351 | $68,938 | $173,413 |
| 2014 | $3,123 | $237,605 | $67,588 | $170,017 |
Source: Public Records
Map
Nearby Homes
- 1 Le Havre Place
- 1527 Hawser Ln
- 1568 Mizzen Ln
- 2786 Pullman Ave
- 408 Beach Ave
- 404 Roosevelt Blvd
- 1350 Cabrillo Hwy N Unit N
- 71 Alameda Ave
- 908 Bancroft Ave
- 533 Alto Ave
- 404 Lee Ave
- 590 Miramar Dr
- 0 3rd Ave Unit ML82006496
- 424 6th Ave
- 567 Terrace Ave
- 0 Upper Terrace Ave
- 608 Silver Ave
- 350 6th Ave
- 414 Belleville Blvd
- 411 Belleville Blvd
- 2016 Avignon Place
- 2024 Avignon Place
- 2017 Avignon Place
- 2013 Avignon Place
- 2028 Avignon Place
- 2012 Avignon Place
- 2009 Avignon Place
- 2060 Avignon Place
- 2008 Avignon Place
- 2032 Avignon Place
- 2028 Touraine Ln
- 2024 Touraine Ln
- 2005 Avignon Place
- 2056 Avignon Place
- 2020 Touraine Ln
- 2032 Touraine Ln
- 2150 Cabrillo Hwy
- 2036 Avignon Place
- 2004 Avignon Place
- 2001 Avignon Place