2020 Chapman Ln Petaluma, CA 94952
Estimated Value: $653,000 - $1,467,000
2
Beds
1
Bath
3,160
Sq Ft
$333/Sq Ft
Est. Value
About This Home
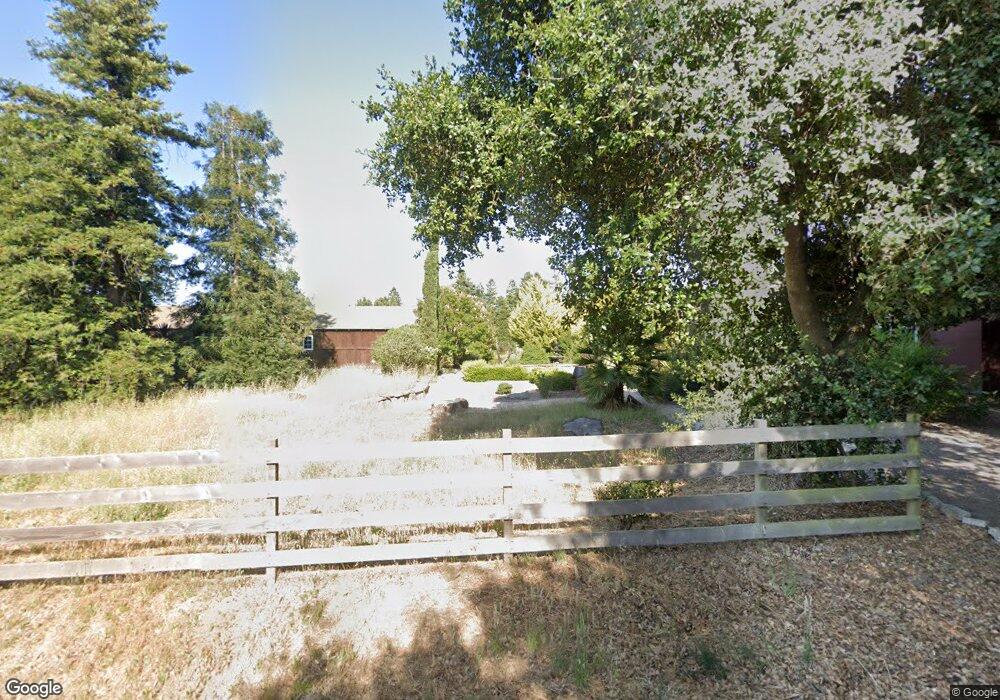
This home is located at 2020 Chapman Ln, Petaluma, CA 94952 and is currently estimated at $1,051,912, approximately $332 per square foot. 2020 Chapman Ln is a home located in Sonoma County with nearby schools including Wilson Elementary School, Petaluma Junior High School, and Petaluma High School.
Ownership History
Date
Name
Owned For
Owner Type
Purchase Details
Closed on
Jul 8, 2009
Sold by
Ellenberg Andrew S
Bought by
Ellenberg Andrew S
Current Estimated Value
Purchase Details
Closed on
Aug 3, 1999
Sold by
Mills Melinda H
Bought by
Ellenberg Andrew S
Home Financials for this Owner
Home Financials are based on the most recent Mortgage that was taken out on this home.
Original Mortgage
$322,000
Interest Rate
7.56%
Purchase Details
Closed on
May 12, 1999
Sold by
Mills Melinda H and Holskey Melinda Lee
Bought by
Mills Melinda H and Melinda H Mills 1999 Family Trust
Purchase Details
Closed on
Dec 7, 1998
Sold by
Mills Gregory L
Bought by
Holskey Melinda Lee and Mills Melinda Lee
Create a Home Valuation Report for This Property
The Home Valuation Report is an in-depth analysis detailing your home's value as well as a comparison with similar homes in the area
Purchase History
| Date | Buyer | Sale Price | Title Company |
|---|---|---|---|
| Ellenberg Andrew S | -- | None Available | |
| Ellenberg Andrew S | $412,000 | First American Title Co | |
| Mills Melinda H | -- | -- | |
| Holskey Melinda Lee | -- | -- |
Source: Public Records
Mortgage History
| Date | Status | Borrower | Loan Amount |
|---|---|---|---|
| Previous Owner | Ellenberg Andrew S | $322,000 |
Source: Public Records
Tax History
| Year | Tax Paid | Tax Assessment Tax Assessment Total Assessment is a certain percentage of the fair market value that is determined by local assessors to be the total taxable value of land and additions on the property. | Land | Improvement |
|---|---|---|---|---|
| 2025 | $3,998 | $351,838 | $241,189 | $110,649 |
| 2024 | $3,998 | $344,940 | $236,460 | $108,480 |
| 2023 | $3,998 | $338,177 | $231,824 | $106,353 |
| 2022 | $3,720 | $331,547 | $227,279 | $104,268 |
| 2021 | $3,638 | $325,047 | $222,823 | $102,224 |
| 2020 | $2,977 | $321,715 | $220,539 | $101,176 |
| 2019 | $3,607 | $315,408 | $216,215 | $99,193 |
| 2018 | $3,586 | $309,225 | $211,976 | $97,249 |
| 2017 | $3,527 | $303,163 | $207,820 | $95,343 |
| 2016 | $3,412 | $297,220 | $203,746 | $93,474 |
| 2015 | $3,369 | $292,756 | $200,686 | $92,070 |
| 2014 | -- | $287,022 | $196,755 | $90,267 |
Source: Public Records
Map
Nearby Homes
- 2103 Bodega Ave
- 599 Cleveland Ave
- 2183 Live Oak Farm Ln
- 12 Dorenfeld Ct
- 13 Dorenfeld Ct
- 509 Larch Dr
- 513 Larch Dr
- 743 Paula Ln
- 716 Elm Dr
- 809 Gilardi Dr
- 1375 Gossage Ave
- 3 Hill Dr
- 1104 Birch Dr
- 852 Western Ave
- 445 Marshall Ave
- 712 Oak Terrace
- 3150 Skillman Ln
- 24 La Cresta Dr
- 301 Broadway St
- 510 Kent St
Your Personal Tour Guide
Ask me questions while you tour the home.