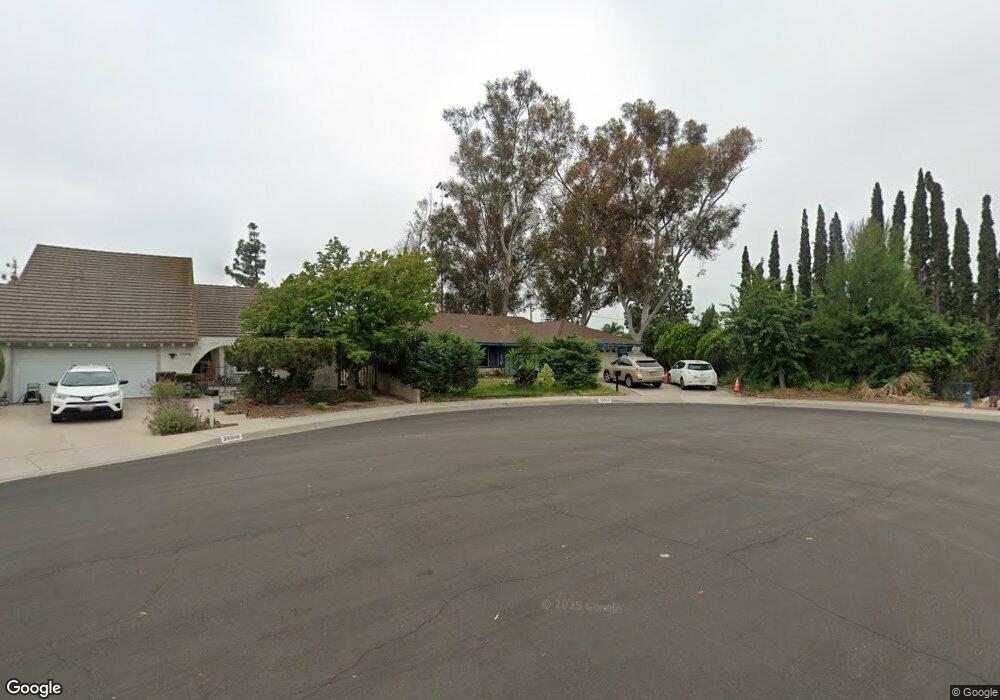
20200 Burnt Tree Ln Walnut, CA 91789
Estimated Value: $1,069,703 - $1,181,000
4
Beds
2
Baths
1,786
Sq Ft
$634/Sq Ft
Est. Value
About This Home
This home is located at 20200 Burnt Tree Ln, Walnut, CA 91789 and is currently estimated at $1,132,426, approximately $634 per square foot. 20200 Burnt Tree Ln is a home located in Los Angeles County with nearby schools including Cyrus J. Morris Elementary School, Suzanne Middle School, and Walnut High School.
Ownership History
Date
Name
Owned For
Owner Type
Purchase Details
Closed on
Mar 29, 2013
Sold by
Wu Sarah R
Bought by
Wu John M
Current Estimated Value
Home Financials for this Owner
Home Financials are based on the most recent Mortgage that was taken out on this home.
Original Mortgage
$330,000
Interest Rate
3.47%
Mortgage Type
New Conventional
Purchase Details
Closed on
Apr 15, 2001
Sold by
Wu Masa H and Wu Lygia L
Bought by
Wu John M
Home Financials for this Owner
Home Financials are based on the most recent Mortgage that was taken out on this home.
Original Mortgage
$130,000
Interest Rate
7.15%
Create a Home Valuation Report for This Property
The Home Valuation Report is an in-depth analysis detailing your home's value as well as a comparison with similar homes in the area
Home Values in the Area
Average Home Value in this Area
Purchase History
| Date | Buyer | Sale Price | Title Company |
|---|---|---|---|
| Wu John M | -- | Fidelity National Title Co | |
| Wu John M | -- | Fidelity National Title Co | |
| Wu John M | $250,000 | American Title Co |
Source: Public Records
Mortgage History
| Date | Status | Borrower | Loan Amount |
|---|---|---|---|
| Closed | Wu John M | $330,000 | |
| Closed | Wu John M | $130,000 | |
| Closed | Wu John M | $50,000 |
Source: Public Records
Tax History
| Year | Tax Paid | Tax Assessment Tax Assessment Total Assessment is a certain percentage of the fair market value that is determined by local assessors to be the total taxable value of land and additions on the property. | Land | Improvement |
|---|---|---|---|---|
| 2025 | $5,246 | $357,899 | $131,096 | $226,803 |
| 2024 | $4,961 | $350,882 | $128,526 | $222,356 |
| 2023 | $4,851 | $344,003 | $126,006 | $217,997 |
| 2022 | $4,757 | $337,259 | $123,536 | $213,723 |
| 2021 | $4,668 | $330,647 | $121,114 | $209,533 |
| 2020 | $4,615 | $327,258 | $119,873 | $207,385 |
| 2019 | $4,535 | $320,842 | $117,523 | $203,319 |
| 2018 | $4,328 | $314,552 | $115,219 | $199,333 |
| 2016 | $4,111 | $302,340 | $110,746 | $191,594 |
| 2015 | $4,115 | $297,800 | $109,083 | $188,717 |
| 2014 | $4,143 | $291,968 | $106,947 | $185,021 |
Source: Public Records
Map
Nearby Homes
- 540 Citadel Dr
- 602 Lone Eagle Rd
- 792 El Vallencito Dr
- 19819 Camino Arroyo
- 330 Amberwood Dr
- 180 Ricci Ave
- 19910 Tennessee Trail
- 20487 Gartel Dr
- 20824 Fuero Dr
- 387 Bourdet St
- 455 Avenida Esplendor
- 1025 N Horseshoe Bend
- 3300 E Millridge Dr
- 309 Camino de Gloria
- 3228 La Puente Rd
- 451 Avenida Esplendor
- 424 S Lemon Ave
- 21002 Cornerstone Dr
- 366 Camino de Teodoro
- 19466 Avenida Del Campo
- 20208 Burnt Tree Ln
- 20130 San Vicente Cir
- 20134 San Vicente Cir
- 20214 Burnt Tree Ln
- 20124 San Vicente Cir
- 20140 San Vicente Cir
- 20201 Burnt Tree Ln
- 20157 Barnard Ave
- 20169 Barnard Ave
- 20220 Burnt Tree Ln
- 20145 Barnard Ave
- 20207 Burnt Tree Ln
- 20179 Barnard Ave
- 20215 Burnt Tree Ln
- 20191 Barnard Ave
- 20133 Barnard Ave
- 20144 San Vicente Cir
- 20120 San Vicente Cir
- 20221 Burnt Tree Ln
- 20228 Burnt Tree Ln
Your Personal Tour Guide
Ask me questions while you tour the home.