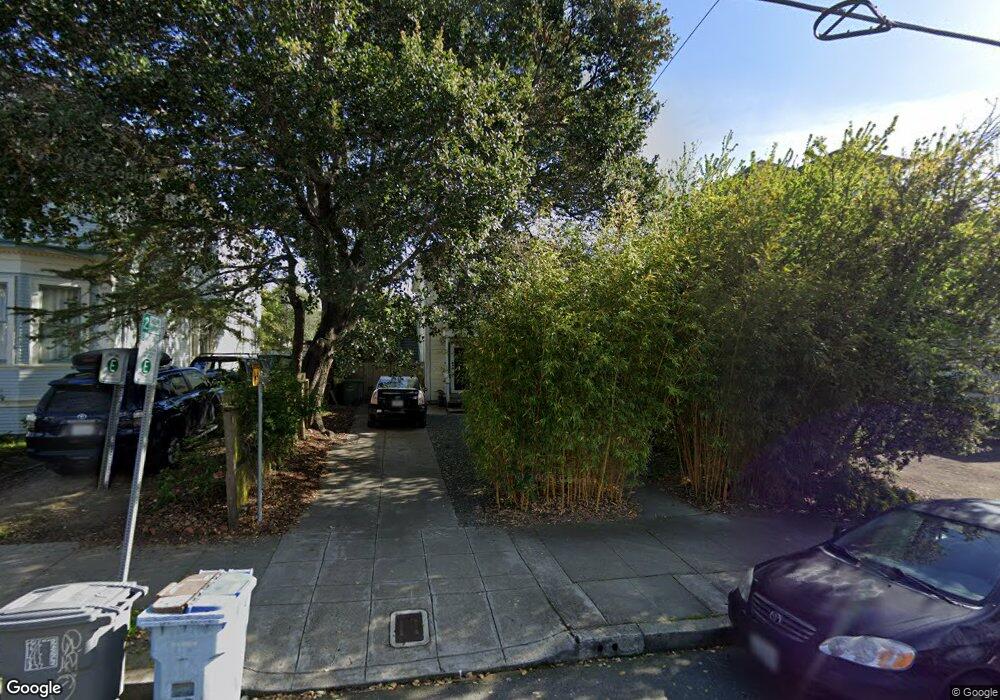
2022 Delaware St Berkeley, CA 94709
North Berkeley NeighborhoodEstimated Value: $1,476,000 - $1,878,000
3
Beds
2
Baths
1,804
Sq Ft
$914/Sq Ft
Est. Value
About This Home
This home is located at 2022 Delaware St, Berkeley, CA 94709 and is currently estimated at $1,649,044, approximately $914 per square foot. 2022 Delaware St is a home located in Alameda County with nearby schools including Berkeley Arts Magnet at Whittier School, Washington Elementary School, and Oxford Elementary School.
Ownership History
Date
Name
Owned For
Owner Type
Purchase Details
Closed on
Jul 7, 2006
Sold by
Seldman Martin L and Reineke Kelly
Bought by
Seldman Martin L and Reineke Kelly R
Current Estimated Value
Purchase Details
Closed on
May 17, 2006
Sold by
Henle Ernst S
Bought by
Seldman Martin L and Reineke Kelly
Purchase Details
Closed on
May 21, 2002
Sold by
Klenota Jill
Bought by
Henle Ernst S
Home Financials for this Owner
Home Financials are based on the most recent Mortgage that was taken out on this home.
Original Mortgage
$200,000
Interest Rate
6.89%
Create a Home Valuation Report for This Property
The Home Valuation Report is an in-depth analysis detailing your home's value as well as a comparison with similar homes in the area
Home Values in the Area
Average Home Value in this Area
Purchase History
| Date | Buyer | Sale Price | Title Company |
|---|---|---|---|
| Seldman Martin L | -- | None Available | |
| Seldman Martin L | $915,000 | Fidelity National Title | |
| Henle Ernst S | -- | Placer Title Company | |
| Henle Ernst S | $250,000 | Placer Title Company |
Source: Public Records
Mortgage History
| Date | Status | Borrower | Loan Amount |
|---|---|---|---|
| Previous Owner | Henle Ernst S | $200,000 |
Source: Public Records
Tax History
| Year | Tax Paid | Tax Assessment Tax Assessment Total Assessment is a certain percentage of the fair market value that is determined by local assessors to be the total taxable value of land and additions on the property. | Land | Improvement |
|---|---|---|---|---|
| 2025 | $17,106 | $1,243,310 | $375,093 | $875,217 |
| 2024 | $17,106 | $1,218,797 | $367,739 | $858,058 |
| 2023 | $16,769 | $1,201,770 | $360,531 | $841,239 |
| 2022 | $16,514 | $1,171,208 | $353,462 | $824,746 |
| 2021 | $16,583 | $1,148,114 | $346,534 | $808,580 |
| 2020 | $15,824 | $1,143,273 | $342,982 | $800,291 |
| 2019 | $15,342 | $1,120,865 | $336,259 | $784,606 |
| 2018 | $15,113 | $1,098,896 | $329,669 | $769,227 |
| 2017 | $14,596 | $1,077,357 | $323,207 | $754,150 |
| 2016 | $14,224 | $1,056,238 | $316,871 | $739,367 |
| 2015 | $14,048 | $1,040,381 | $312,114 | $728,267 |
| 2014 | $13,127 | $955,000 | $286,500 | $668,500 |
Source: Public Records
Map
Nearby Homes
- 2015 Delaware St
- 2015 Delaware St Unit A
- 1625 Martin Luther King jr Way
- 1610 Milvia St
- 1609 Bonita Ave Unit 3
- 1609 Bonita Ave Unit 5
- 1682 Oxford St
- 2201 Virginia St Unit 2
- 2218 -2222 Grant St
- 2340 Virginia St
- 1519 Oxford St Unit E
- 2365 Virginia St Unit 2
- 1444 Walnut St
- 1815 Vine St
- 1425 Martin Luther King jr Way
- 1622 Scenic Ave
- 2451 Le Conte Ave
- 1440 Walnut St Unit 5
- 2012 Rose St
- 2477 Virginia St
- 2026 Delaware St
- 2018 Delaware St
- 2016 Delaware St Unit A
- 2016 Delaware St Unit Front House
- 2016 Delaware St Unit A
- 2016 Delaware St
- 2016 Delaware St
- 2016 Delaware St Unit C
- 2025 Hearst Ave
- 2027 Hearst Ave
- 2029 Hearst Ave
- 2021 Hearst Ave Unit B
- 2021 Hearst Ave Unit B
- 2023 Hearst Ave Unit A
- 2014 Delaware St
- 2019 Hearst Ave
- 2015 Hearst Ave
- 2033 Hearst Ave
- 2027 Delaware St
- 2023 Delaware St
Your Personal Tour Guide
Ask me questions while you tour the home.