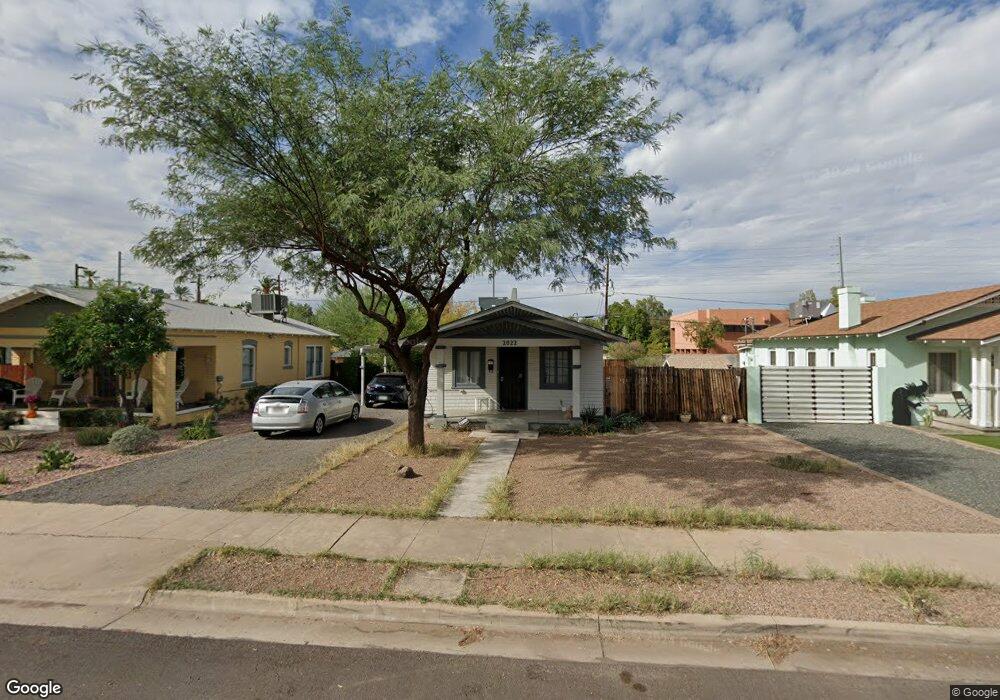
2022 N 8th St Phoenix, AZ 85006
Coronado NeighborhoodEstimated Value: $361,000 - $564,464
3
Beds
2
Baths
780
Sq Ft
$604/Sq Ft
Est. Value
About This Home
This home is located at 2022 N 8th St, Phoenix, AZ 85006 and is currently estimated at $471,116, approximately $603 per square foot. 2022 N 8th St is a home located in Maricopa County with nearby schools including Emerson Elementary School, North High School, and Phoenix Coding Academy.
Ownership History
Date
Name
Owned For
Owner Type
Purchase Details
Closed on
Sep 3, 2014
Sold by
Gannon Domini J
Bought by
Conley Daniella M
Current Estimated Value
Purchase Details
Closed on
Sep 26, 2011
Sold by
Raynes Derrick
Bought by
Gannon Domini J
Home Financials for this Owner
Home Financials are based on the most recent Mortgage that was taken out on this home.
Original Mortgage
$122,805
Interest Rate
4.37%
Mortgage Type
FHA
Purchase Details
Closed on
Jul 30, 2010
Sold by
Peiffer Jonathan L and Giron Debra E
Bought by
Raynes Derrick
Purchase Details
Closed on
Jul 6, 1994
Sold by
Mcdaniel Steven H and Douglas Mcdaniel L
Bought by
Peiffer Jonathan L and Peiffer Debra E
Home Financials for this Owner
Home Financials are based on the most recent Mortgage that was taken out on this home.
Original Mortgage
$58,900
Interest Rate
8.38%
Create a Home Valuation Report for This Property
The Home Valuation Report is an in-depth analysis detailing your home's value as well as a comparison with similar homes in the area
Home Values in the Area
Average Home Value in this Area
Purchase History
| Date | Buyer | Sale Price | Title Company |
|---|---|---|---|
| Conley Daniella M | $150,000 | Lawyers Title Of Arizona Inc | |
| Gannon Domini J | $126,000 | Magnus Title Agency | |
| Raynes Derrick | $58,000 | Great American Title Agency | |
| Peiffer Jonathan L | $62,000 | Transamerica Title Ins Co |
Source: Public Records
Mortgage History
| Date | Status | Borrower | Loan Amount |
|---|---|---|---|
| Previous Owner | Gannon Domini J | $122,805 | |
| Previous Owner | Peiffer Jonathan L | $58,900 |
Source: Public Records
Tax History Compared to Growth
Tax History
| Year | Tax Paid | Tax Assessment Tax Assessment Total Assessment is a certain percentage of the fair market value that is determined by local assessors to be the total taxable value of land and additions on the property. | Land | Improvement |
|---|---|---|---|---|
| 2025 | $1,466 | $11,100 | -- | -- |
| 2024 | $1,363 | $10,572 | -- | -- |
| 2023 | $1,363 | $34,400 | $6,880 | $27,520 |
| 2022 | $1,313 | $27,780 | $5,550 | $22,230 |
| 2021 | $1,309 | $24,120 | $4,820 | $19,300 |
| 2020 | $1,327 | $23,260 | $4,650 | $18,610 |
| 2019 | $1,326 | $20,660 | $4,130 | $16,530 |
| 2018 | $1,303 | $16,870 | $3,370 | $13,500 |
| 2017 | $1,263 | $15,770 | $3,150 | $12,620 |
| 2016 | $1,227 | $12,330 | $2,460 | $9,870 |
| 2015 | $1,125 | $11,000 | $2,200 | $8,800 |
Source: Public Records
Map
Nearby Homes
- 2211 N 7th St
- 2030 N 10th St
- 2221 N Richland St
- 1650 N 10th St
- 2241 N Richland St
- 341 E Monte Vista Rd
- 385 E Coronado Rd Unit 6
- 319 E Palm Ln
- 319 E Palm Ln Unit 36
- 325 E Coronado Rd Unit 10
- 325 E Coronado Rd Unit 13
- 2046 N 11th St
- 319 E Coronado Rd Unit 1
- 2206 N 11th St
- 2034 N Mitchell St
- 0000 N 7th St
- 0 N 7th St Unit 6930924
- 190 E Coronado Rd Unit 73
- 123 E Palm Ln Unit A
- 1116 E Almeria Rd
- 2026 N 8th St
- 2026 N 8th St Unit B
- 2026 N 8th St Unit A
- 2018 N 8th St
- 2014 N 8th St
- 2030 N 8th St
- 2034 N 8th St
- 2015 N 8th St
- 2021 N 8th St
- 2025 N 8th St
- 2038 N 8th St
- 2013 N 8th St
- 2029 N 8th St
- 706 E Palm Ln
- 706 E Palm Ln Unit 1
- 706 E Palm Ln Unit 2
- 706 E Palm Ln Unit 12
- 2033 N 8th St
- 2033 N 8th St Unit GH
- 2042 N 8th St