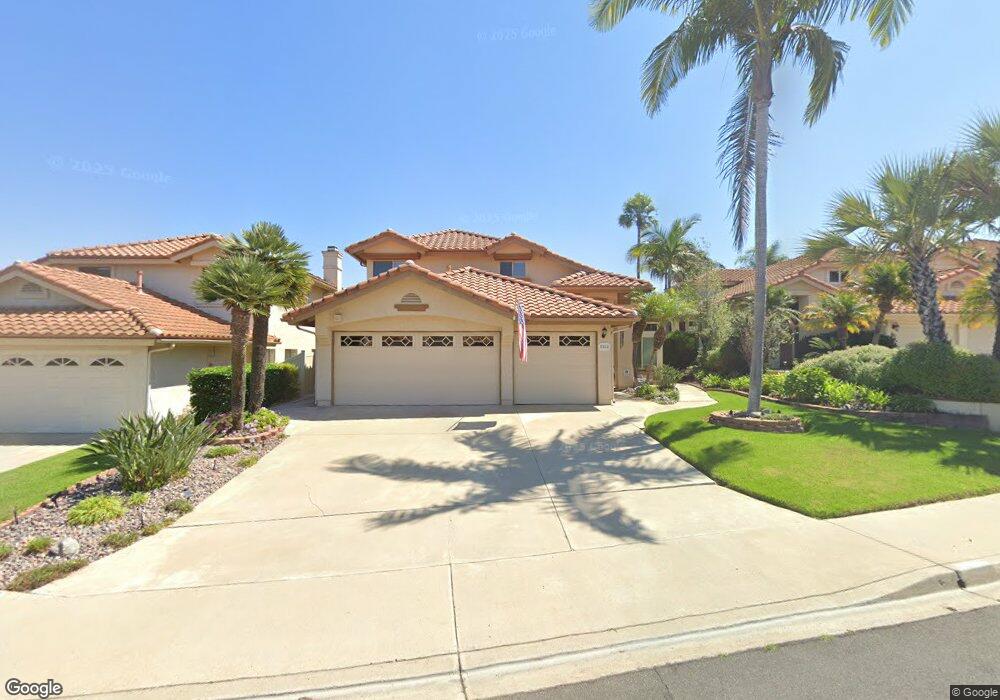
2022 Sequoia Crest Vista, CA 92081
Shadowridge NeighborhoodEstimated Value: $1,201,988 - $1,331,000
4
Beds
3
Baths
2,679
Sq Ft
$472/Sq Ft
Est. Value
About This Home
This home is located at 2022 Sequoia Crest, Vista, CA 92081 and is currently estimated at $1,264,997, approximately $472 per square foot. 2022 Sequoia Crest is a home located in San Diego County with nearby schools including Lake Elementary School, Madison Middle School, and Rancho Buena Vista High School.
Ownership History
Date
Name
Owned For
Owner Type
Purchase Details
Closed on
Mar 14, 2017
Sold by
Alandt Johanna M and Matarazzo Patrick Robert
Bought by
Alandt Johanna M
Current Estimated Value
Purchase Details
Closed on
Oct 13, 2000
Sold by
Alandt Johanna M
Bought by
Alandt Johanna M and Matarazzo Patrick Robert
Purchase Details
Closed on
May 18, 1999
Sold by
Taylor David H and Taylor Gretchen C
Bought by
Alandt Johanna M
Purchase Details
Closed on
Oct 8, 1996
Sold by
Anderson Leo O and Anderson Rose R
Bought by
Taylor David H and Taylor Gretchen C
Home Financials for this Owner
Home Financials are based on the most recent Mortgage that was taken out on this home.
Original Mortgage
$196,000
Interest Rate
7.91%
Mortgage Type
Balloon
Purchase Details
Closed on
Feb 1, 1988
Create a Home Valuation Report for This Property
The Home Valuation Report is an in-depth analysis detailing your home's value as well as a comparison with similar homes in the area
Home Values in the Area
Average Home Value in this Area
Purchase History
| Date | Buyer | Sale Price | Title Company |
|---|---|---|---|
| Alandt Johanna M | -- | None Available | |
| Alandt Johanna M | -- | -- | |
| Alandt Johanna M | $308,000 | First American Title | |
| Taylor David H | $245,000 | Fidelity National Title Co | |
| -- | $187,500 | -- |
Source: Public Records
Mortgage History
| Date | Status | Borrower | Loan Amount |
|---|---|---|---|
| Previous Owner | Taylor David H | $196,000 |
Source: Public Records
Tax History
| Year | Tax Paid | Tax Assessment Tax Assessment Total Assessment is a certain percentage of the fair market value that is determined by local assessors to be the total taxable value of land and additions on the property. | Land | Improvement |
|---|---|---|---|---|
| 2025 | $5,746 | $473,358 | $98,573 | $374,785 |
| 2024 | $5,746 | $464,078 | $96,641 | $367,437 |
| 2023 | $5,625 | $454,980 | $94,747 | $360,233 |
| 2022 | $5,611 | $446,060 | $92,890 | $353,170 |
| 2021 | $5,487 | $437,315 | $91,069 | $346,246 |
| 2020 | $5,455 | $432,832 | $90,136 | $342,696 |
| 2019 | $5,378 | $424,346 | $88,369 | $335,977 |
| 2018 | $5,145 | $416,027 | $86,637 | $329,390 |
| 2017 | $5,062 | $407,871 | $84,939 | $322,932 |
| 2016 | $4,944 | $399,874 | $83,274 | $316,600 |
| 2015 | $4,917 | $393,869 | $82,024 | $311,845 |
| 2014 | $4,798 | $386,155 | $80,418 | $305,737 |
Source: Public Records
Map
Nearby Homes
- 2198 Redwood Crest
- 1977 White Birch Dr
- 6055 Dassia Way
- 6015 Dassia Way
- 4246 Lindos Way
- 4920 Keos Way
- 3732 Via Cabrillo
- 1831 Olympus Loop Dr
- 2082 Fairhope Loop Unit 186
- 1839 Saint Thomas Rd
- 1672 Olympus Loop Dr
- 1667 Olympus Loop Dr
- 1816 Cayman Way
- 1831 Monserrat Way
- 4169 Rhodes Way
- 4706 Zamora Way
- 4710 Cordoba Way
- 1734 Countryside Dr
- 1684 Countryside Dr
- 4744 Agora Way
- 2018 Sequoia Crest
- 2026 Sequoia Crest
- 2014 Sequoia Crest
- 2030 Sequoia Crest
- 2014 Sequoia Cr
- 2020 White Birch Dr
- 2016 White Birch Dr
- 2024 White Birch Dr
- 2012 White Birch Dr
- 2032 Sequoia Crest
- 2028 White Birch Dr
- 2027 Sequoia Crest
- 2023 Sequoia Crest
- 2008 Sequoia Crest
- 2017 Sequoia Crest
- 2031 Sequoia Crest
- 2010 White Birch Dr
- 2030 White Birch Dr
- 2036 Sequoia Crest
- 2033 Sequoia Crest
Your Personal Tour Guide
Ask me questions while you tour the home.