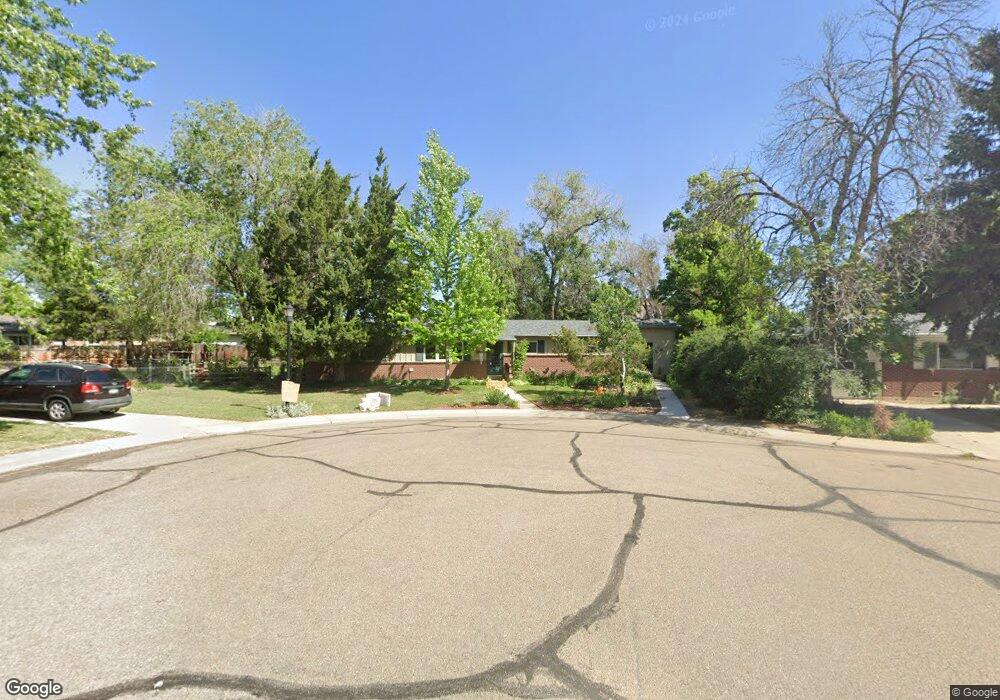
2022 Sherri Mar Place Longmont, CO 80501
Loomiller NeighborhoodEstimated Value: $520,000 - $553,000
3
Beds
2
Baths
1,335
Sq Ft
$399/Sq Ft
Est. Value
About This Home
This home is located at 2022 Sherri Mar Place, Longmont, CO 80501 and is currently estimated at $533,072, approximately $399 per square foot. 2022 Sherri Mar Place is a home located in Boulder County with nearby schools including Mountain View Elementary School, Longs Peak Middle School, and Longmont High School.
Ownership History
Date
Name
Owned For
Owner Type
Purchase Details
Closed on
Mar 26, 2020
Sold by
Vinck John M and Vinck Helen A
Bought by
Vinck John M and Vinck Belen A
Current Estimated Value
Purchase Details
Closed on
Oct 12, 2007
Sold by
Vinck Cassandra L and Vinck Jennifer A
Bought by
Vinck John M
Purchase Details
Closed on
Jun 14, 2001
Sold by
Potter David and Potter Lisa
Bought by
Vinck Cassandra L
Home Financials for this Owner
Home Financials are based on the most recent Mortgage that was taken out on this home.
Original Mortgage
$139,000
Interest Rate
7.1%
Purchase Details
Closed on
Sep 15, 1997
Sold by
Colard Roy D & Katherine Living Trust
Bought by
Potter David
Home Financials for this Owner
Home Financials are based on the most recent Mortgage that was taken out on this home.
Original Mortgage
$132,400
Interest Rate
9%
Mortgage Type
Seller Take Back
Purchase Details
Closed on
Jan 8, 1996
Sold by
Colard Katherine
Bought by
The Roy D & Katherine Colard Living Tr
Purchase Details
Closed on
Jan 20, 1995
Sold by
Trotter Donald Joseph
Bought by
Colard Katherine
Create a Home Valuation Report for This Property
The Home Valuation Report is an in-depth analysis detailing your home's value as well as a comparison with similar homes in the area
Home Values in the Area
Average Home Value in this Area
Purchase History
| Date | Buyer | Sale Price | Title Company |
|---|---|---|---|
| Vinck John M | -- | None Available | |
| Vinck John M | $140,000 | Fahtco | |
| Vinck Cassandra L | $174,000 | First American Heritage Titl | |
| Potter David | $139,900 | -- | |
| The Roy D & Katherine Colard Living Tr | -- | -- | |
| Colard Katherine | $111,999 | -- |
Source: Public Records
Mortgage History
| Date | Status | Borrower | Loan Amount |
|---|---|---|---|
| Previous Owner | Vinck Cassandra L | $139,000 | |
| Previous Owner | Potter David | $132,400 |
Source: Public Records
Tax History Compared to Growth
Tax History
| Year | Tax Paid | Tax Assessment Tax Assessment Total Assessment is a certain percentage of the fair market value that is determined by local assessors to be the total taxable value of land and additions on the property. | Land | Improvement |
|---|---|---|---|---|
| 2025 | $2,778 | $36,081 | $6,644 | $29,437 |
| 2024 | $2,778 | $36,081 | $6,644 | $29,437 |
| 2023 | $2,778 | $36,147 | $7,397 | $32,435 |
| 2022 | $2,321 | $30,407 | $5,442 | $24,965 |
| 2021 | $1,698 | $24,581 | $5,598 | $18,983 |
| 2020 | $1,359 | $21,143 | $5,649 | $15,494 |
| 2019 | $1,338 | $21,143 | $5,649 | $15,494 |
| 2018 | $1,070 | $18,468 | $5,040 | $13,428 |
| 2017 | $1,730 | $20,417 | $5,572 | $14,845 |
| 2016 | $1,566 | $16,382 | $5,970 | $10,412 |
| 2015 | $1,492 | $14,781 | $4,696 | $10,085 |
| 2014 | $1,381 | $14,781 | $4,696 | $10,085 |
Source: Public Records
Map
Nearby Homes
- 1262 Lanyon Ln
- 1406 Hover St
- 1414 Linden St
- 1245 Sumner St
- 1520 Tulip Ct
- 2103 Rangeview Ln
- 1350 Stuart St
- 1202 Vivian St
- 1460 Belmont Dr
- 1321 Judson St
- 1626 Tulip Ct
- 24 Cedar Ct
- 1517 Amherst Dr
- 895 Faith Ct
- 835 Hillside Ct
- 865 Widgeon Cir
- 1379 Charles Dr
- 1379 Charles Dr Unit 7
- 1379 Charles Dr Unit 4
- 1379 Charles Dr Unit 5
- 2016 Sherri Mar Place
- 1209 Sherri Mar Ct
- 17 Denise Place
- 1228 Frontier Dr
- 1222 Frontier Dr
- 1234 Frontier Dr
- 2010 Sherri Mar Place
- 1201 Sherri Mar Ct
- 1214 Frontier Dr
- 23 Denise Place
- 1206 Frontier Dr
- 11 Denise Place
- 1240 Frontier Dr
- 2002 Sherri Mar Place
- 1149 Sherri Mar Ct
- 1200 Frontier Dr
- 1152 Sherri Mar Ct
- 1225 Spencer St
- 2003 Sherri Mar Place
- 1246 Frontier Dr