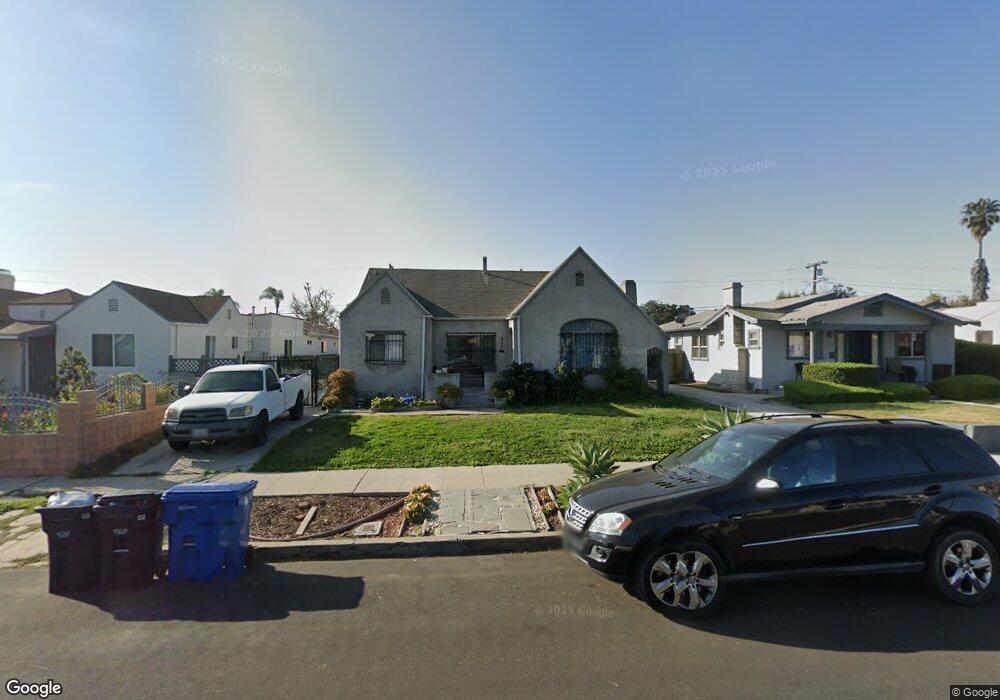
2022 W 78th Place Los Angeles, CA 90047
Manchester Square NeighborhoodEstimated Value: $665,000 - $837,000
2
Beds
1
Bath
1,090
Sq Ft
$669/Sq Ft
Est. Value
About This Home
This home is located at 2022 W 78th Place, Los Angeles, CA 90047 and is currently estimated at $728,713, approximately $668 per square foot. 2022 W 78th Place is a home located in Los Angeles County with nearby schools including Seventy-Fourth Street Elementary School, Horace Mann Ucla Community, and George Washington Preparatory High School.
Ownership History
Date
Name
Owned For
Owner Type
Purchase Details
Closed on
Mar 1, 2010
Sold by
Mzoughi Mourad
Bought by
Favila Martha and Mzoughi Mourad
Current Estimated Value
Home Financials for this Owner
Home Financials are based on the most recent Mortgage that was taken out on this home.
Original Mortgage
$250,813
Outstanding Balance
$170,494
Interest Rate
5.5%
Mortgage Type
FHA
Estimated Equity
$558,219
Purchase Details
Closed on
Mar 5, 2003
Sold by
Weakley Rugena
Bought by
Mzoughi Mourad
Home Financials for this Owner
Home Financials are based on the most recent Mortgage that was taken out on this home.
Original Mortgage
$209,000
Interest Rate
5.79%
Purchase Details
Closed on
Mar 17, 1998
Sold by
Brooks Darryl
Bought by
Weakley Rugena
Home Financials for this Owner
Home Financials are based on the most recent Mortgage that was taken out on this home.
Original Mortgage
$121,476
Interest Rate
7.06%
Mortgage Type
FHA
Create a Home Valuation Report for This Property
The Home Valuation Report is an in-depth analysis detailing your home's value as well as a comparison with similar homes in the area
Home Values in the Area
Average Home Value in this Area
Purchase History
| Date | Buyer | Sale Price | Title Company |
|---|---|---|---|
| Favila Martha | -- | Meymax Title Agency | |
| Mzoughi Mourad | $220,000 | Gtc | |
| Weakley Rugena | $122,500 | Fidelity National Title |
Source: Public Records
Mortgage History
| Date | Status | Borrower | Loan Amount |
|---|---|---|---|
| Open | Favila Martha | $250,813 | |
| Closed | Mzoughi Mourad | $209,000 | |
| Previous Owner | Weakley Rugena | $121,476 |
Source: Public Records
Tax History Compared to Growth
Tax History
| Year | Tax Paid | Tax Assessment Tax Assessment Total Assessment is a certain percentage of the fair market value that is determined by local assessors to be the total taxable value of land and additions on the property. | Land | Improvement |
|---|---|---|---|---|
| 2025 | $4,485 | $357,357 | $211,250 | $146,107 |
| 2024 | $4,485 | $350,351 | $207,108 | $143,243 |
| 2023 | $4,406 | $343,483 | $203,048 | $140,435 |
| 2022 | $4,210 | $336,749 | $199,067 | $137,682 |
| 2021 | $4,154 | $330,147 | $195,164 | $134,983 |
| 2019 | $4,035 | $320,356 | $189,376 | $130,980 |
| 2018 | $3,960 | $314,075 | $185,663 | $128,412 |
| 2016 | $3,785 | $301,881 | $178,454 | $123,427 |
| 2015 | $3,016 | $237,264 | $175,774 | $61,490 |
| 2014 | $3,036 | $232,617 | $172,331 | $60,286 |
Source: Public Records
Map
Nearby Homes
- 1950 W 79th St
- 1922 W 78th Place
- 1937 W 80th St
- 2206 W 78th Place
- 1850 W 80th St
- 1912 W 76th St
- 1826 W 78th St
- 1935 W 76th St
- 1818 W 79th St
- 2127 W 76th St
- 2228 W 78th St
- 2306 W 79th St
- 2311 W 78th Place
- 7727 S Western Ave
- 1816 W 76th St
- 8014 S Western Ave
- 2416 W 80th St
- 1932 W 84th St
- 1728 W 81st St
- 7803 S Harvard Blvd
- 2016 W 78th Place Unit 1
- 2016 W 78th Place
- 2026 W 78th Place
- 2026 W 78th St
- 2016 W 78th St
- 2012 W 78th Place
- 2032 W 78th Place
- 2023 W 79th St
- 2008 W 78th St
- 2017 W 79th St
- 2027 W 79th St
- 2008 W 78th Place
- 2036 W 78th Place
- 2015 W 79th St
- 2033 W 79th St
- 2023 W 78th Place
- 2000 W 78th St
- 2042 W 78th Place
- 2037 W 79th St
- 2007 W 79th St